Better ways to look at what we’re doing to Chesapeake Bay?
Bill Nuttle ·New ways of looking at data promise to give a clearer picture of the effects of restoration in the ecosystem.
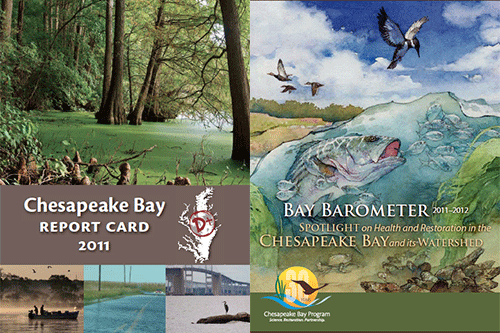
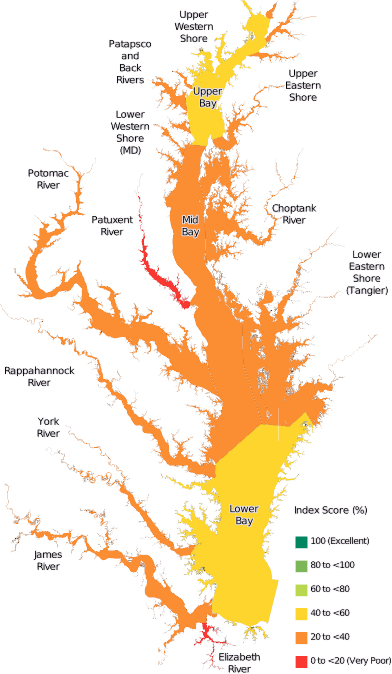
People have worked hard to bring the Chesapeake Bay back to health. Yet, why is it so difficult to see the results? The IAN program’s Chesapeake Bay Report Card for 2011 gives the bay a D+. The EPA’s Chesapeake Bay program notes “the reality of a degraded bay ecosystem” in the Bay Barometer 2011-2012 report released in January, but offers guarded optimism that we can expect to see encouraging news once the results from 2012 are fully analyzed. Significant progress has been made in reducing nitrogen, phosphorous, and sediment inputs from the watershed – the main goals of restoration efforts initiated 30 years ago. And managers are hopeful that data from 2012 will show an improvement when the analysis is complete.

One reason for why we are not getting a better picture of restoration’s effects has to do with the dynamics of the ecosystem. The Chesapeake Bay is the largest estuary in the US with a watershed that spans six states and the District of Columbia. As a result, there is a delay in the response of conditions in the bay to management actions on its watershed, and this has to be factored in. The recent less-than-stellar news is balanced by the fact that 2011 was an unusually wet year, which had a major negative effect on the health of the bay ecosystem.
Other reasons for less than satisfying reports may be found in the reports themselves. To be credible, reporting on conditions in the ecosystem must follow a consistent approach that is scientifically defensible and backed up by data. Are we measuring all the right characteristics of the ecosystem? Do the reports interpret these results in a way that addresses the most pressing concerns to people?
In this post, I want to address three possible sources of dissatisfaction in the approach to reporting: the tortoise and the hare; curbing our enthusiasm; and keeping eyes on the ball.
The tortoise and the hare
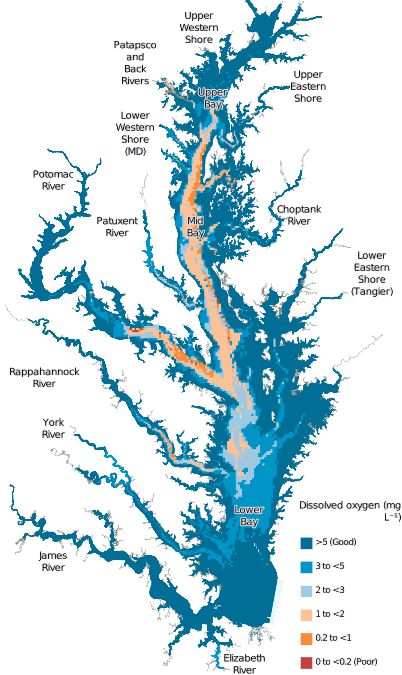
In the race between the tortoise and the hare, it is the hare that attracts all the attention. Lets divide the factors that influence the changes we see in the Chesapeake Bay ecosystem into two categories: things that people do and everything else. Notably, everything else includes climate and weather, particularly stormy weather. Compared to any thing that people do, weather systems have a much bigger effect. Weather changes quickly and the power of a single storm can radically change conditions in the bay, like stratification and oxygen concentrations, over the course of a day or two. Summarizing the changes that have taken place in the Chesapeake Bay over the course of a year is like providing commentary on the race between a tortoise and a hare. Over the course of a single year the effects of weather and climate will always outrun the effects of things that people do.
Curbing our enthusiasm
Basing reports on science gives us confidence, but this comes at the cost of consciously curbing the enthusiasm for reporting an outcome that we would all like to see. Scientists are perhaps the worst people to ask to call a race. A scientist will only ever tell you who probably won the race and that only within a certain margin of error. Even worse, if you ask them to confirm the hypothesis that restoration is having a positive effect on the bay, then a good scientist is duty-bound to tell you why you are wrong. That’s just the way scientists are trained to think. It is even worse for the authors of the EPA report. The EPA’s Chesapeake Bay program was criticized a few years ago, by the U.S. Government Accountability Office, for including extraneous information in their reports that gave a confused the picture of conditions in the ecosystem. Since then, the EPA has been extra careful that the information they provide is scientifically correct.

Over time, scientists have honed their ability to read changing conditions in the ecosystem. New techniques for analyzing monitoring data are emerging that are better suited to see the effect that restoration is having separate from the influence of weather and changes in climate. Using a new method of looking at data on water flow, nitrogen and phosphorous, Hirsch et al (2010) are able to evaluate changes in nutrient loading decade by decade. These changes might reveal the effect of efforts to control nutrient inputs taking effect. More study is needed to be certain. Similarly, recent study of hypoxia events by Murphy et al. (2011) was able to discern the separate effects that changing nutrient loads and changing weather patterns have on the onset and intensity of summer anoxia events in the bay. New ways of looking at the data are possible now simply because of the amount of data that has accumulated from ongoing monitoring programs. More data equals more information, and scientists are learning how to extract new information about changes in the ecosystem and what is driving them. But, this new information has not yet made it into the reports.
Keeping eyes on the ball
The effort to track conditions in the bay for restoration is not keeping up with other changes to the Chesapeake Bay ecosystem. By remaining focused on restoration’s original goals, reporting on conditions in the bay may no longer address all of the concerns people consider most important. Monitoring and reporting on conditions in the bay are designed mainly to support the goal of reducing the inflow of nutrients, which was established as restoration’s main focus 30 years ago. A lot has happened over that time that has changed the ecosystem and goals people have for it. In particular, the phenomenon of climate change related to global warming, has taken hold. Increasingly, the effects of climate change and the related phenomenon of accelerated sea level rise are affecting conditions in the bay, in coastal communities, and people’s activities in the bay’s watershed.
At the same time our understanding of the bay’s ecosystem has expanded, and how we track and report on the condition of the ecosystem must take this into account. Several changes are being considered to EcoCheck’s annual Chesapeake Bay report card. One possible change involves adjusting index scores for changes in river discharge. River discharge captures a lot of the effect that variable weather and climate have in the ecosystem, and by making this adjustment the scores will give greater emphasis to the effects that restoration efforts are having. New indices are being tested that would expand the scope of the report card to include living resources, like crabs and striped bass. It might also be possible to develop new bay-wide indices related to human health, as we have done in a report card for Baltimore Harbor.
We are also considering other ways of looking at changing conditions in the Chesapeake Bay and what people are doing. What can we do differently to balance reporting on the effects of the flighty rabbit of weather and the slow, methodical tortoise of restoration? How can we use the additional information provided by new approaches to data analysis? What attributes of the ecosystem should we add in order to better represent the expanded scope of the bay-watershed-people ecosystem? Posts to this blog will consider these questions in the upcoming months.
References:
Baltimore Harbor Report Card 2012
Chesapeake Bay Report Card 2011
Murphy, R.R., W.M. Kemp, and W.P. Ball, 2011. Long-term trends in Chesapeake Bay seasonal hypoxia, stratification, and nutrient loading. Estuaries and Coasts 34:1293-1309.
Hirsch, R.M., D.L. Moyer, and S.A. Archfield, 2010. Weighted regressions on time, discharge, and season (WRTDS), with application to Chesapeake Bay river inputs. Journal of the American Water Resources Association 46:857-880.
