How is your ecosystem doing? Advances in the use and understanding of ecosystem indicators workshop
Bill Dennison ·As part of the 2nd International Ocean Research Conference in Barcelona, Spain, Lynne Shannon (University of Cape Town) and I organized a pre-conference workshop on ecosystem indicators. This workshop proved to be a valuable opportunity to explore the development and use of ecosystem indicators. The workshop summary is as follows:
How is your ecosystem doing? Advances in the use and understanding of ecosystem indicators workshop
Conveners: William C. Dennison (University of Maryland Center for Environmental Science), Lynne Shannon (University of Cape Town)
Quick summary
1) To answer the question of how your ecosystem is doing, we need to a) define the management objectives, b) provide an assessment relative to spatial, temporal or regulatory standards, and c) embed the assessment within a decision framework.
2) Assessments need to be conducted by credible, unbiased organizations.
3) Assessments should strive for diverse indicators (ecological, social, economic) with spatial resolution and appropriate levels of integration, and should involve local expertise to ensure correct interpretation of what the indicators are telling us for each ecosystem/situation.
Workshop summary
Workshop participants from North and South America, Europe, Africa, Asia and Australia employed a wide variety of indicators including ecological indicators (e.g., plankton, biodiversity, dissolved organic carbon, fish), social and economic indicators. Indicators were used for environmental characterization, status and trend reporting, environmental report cards, integrated assessments, ecological forecasts, management and governance. The aim was to have indicators that were simple, available, easily understandable and rigorous.
In the examples presented, the indicators being monitored were generally declining, indicative of degrading environmental conditions. However, this may be a biased sampling, since the motivation to monitor various indicators may have been the perception of a degrading environmental condition.

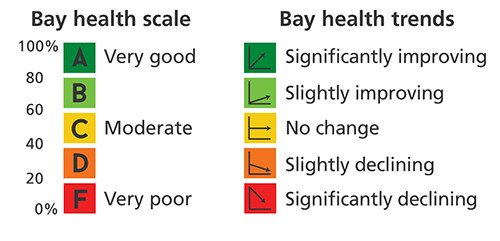
The use of colors in reporting schemes was variable. In some cases a ‘heat legend’ was used in which poor indicator status was red, intermediate = yellow and good = blue. In the majority of cases a ‘stoplight legend’ was used in which poor indicator status was red, intermediate = yellow and good = green. Each of these schemes were intuitive and fairly easy to understand. But when the heat and stoplight colors were intermixed (both blue and green), a confusing picture emerged and the workshop recommendation was to use either heat or stoplight schemes and to not mix them.
To answer the question “How is your ecosystem doing?”, several considerations were raised. First, the management objectives need to be defined, such as ecosystem health, fisheries goals or economic sustainability. These objectives will help in the choice of indicators as well as determining the thresholds for each indicator. Second, the indicators need to be ranked or scored relative to something. That ‘something’ can be comparisons with other geographic locations (spatial comparisons), for example, indicators can be compared relative to a less impacted region as an aspirational goal. Indicators can also be compared to different time periods (temporal comparisons), are necessary across different spatial and temporal scales, and the trend rather than the status may be more important in a management context. There are regulatory standards as well that can serve as thresholds to compare indicator status. Third, the indicators need to be embedded within a decision support system, which may entail weighting the indicators relative to one another according to ability of an indicator to measure specific effects or attributes relative to other indicators in a set. It is of little use to just report indicator status without mechanisms to act upon that knowledge. Understanding the drivers or causes of indicator response and the feedbacks involved is also of key importance within the decision support system.

The issue of who does the assessment is relevant to the credibility and uptake of the results. The key is to have a credible, unbiased organization willing to conduct the assessment and be willing to defend it publically. This role is typically filled by academia or non-government organizations. Even with competent people conducting rigorous assessments within government, the perception of biased results permeates the public discussion engendered by government assessments. A working knowledge of the assessment region is also essential for the report to have credibility. Credibility can also be enhanced with transparency in the data collected, analyses and reporting, and by involvement of, or at least communication with stakeholders from early in the process.
Assessments should strive for diverse indicators, in particular ecological, social and economic indicators. The spatial resolution of assessments affects their utility. The smaller scale assessments are more effective at stimulating local management actions. The larger scale assessments become more about raising awareness rather than stimulating a management action. There is a challenge of developing combined (integrated) indices and various aggregated scores that are appropriate to the data density and useful for management interpretation.
The issue of multiple partners involved in assessments was a common theme. Clear methodologies and lines of responsibility are necessary when multiple partners are involved. Special attention needs to be made to maintain quality control. There was a recognition that there are ‘transactional costs’ in order to maintain adequate communication between different partners. This can be difficult when making connections between terrestrial vs. marine scientific cultures, often necessary in coastal ocean monitoring. Terrestrial vs. marine scientists typically attend different conferences, are members in different scientific societies and publish in different journals. Citizen science input to monitoring programs accentuates these issues and raises additional concerns including training, turnover, and safety.
Several recommendations for scientists involved in assessments were made to ensure appropriate contextualization of indicators and assessments:
- Develop consistent reporting approaches
- Create a publicly accessible data base of different environmental report cards
- Produce best practice guidelines through a respected scientific organization (e.g., Intergovernmental Oceanographic Commission)
- Standardize communication approaches so that environmental assessments can be more easily compared
- Endeavor to develop climate change indicators
There are several recent advances in indicator development including the creation of combined indices (e.g., indices of biotic integrity), scoring and ranking schemes, statistical methods, incorporation into decision support systems. Attributes of good indicators include the following:
- Simple to understand
- Measurable parameters
- Map-able data
- Related to an important process
- Explicitly linked to drivers
- Responsive
There are a variety of human health indicators that reflect the desire for ‘swimmable’ and ‘fishable’ water quality. The use of a pressure – state – response model for categorizing indicators can be useful. For example, the ecological pressure of excess nutrients entering waterways can be quantified as loading rates (e.g., mass/time). The state of the environment regarding nutrients can be assessed (e.g., concentration) as well as management response (e.g., reduction in nutrient delivery). Each of these indicators are valuable but need to be reported separately. There are several factors that affect indicator selection including the following:
- Composition, interests and needs of the resource managers and scientists
- Information availability; resources available for monitoring, capacity to monitor
- Practicality of measuring, interpreting and reporting data
- Degree of public interest
- Diversity; capturing the broadest spectrum of processes and transboundary applicability
The workshop illustrated the importance of developing a scientific community focused on indicators, assessments and environmental reporting. The establishment of best practices, the ability to learn from one another and the ability to discern patterns and trends by comparing different ecosystems would be promoted by this scientific community. The Intergovernmental Oceanographic Commission could play a role in consolidation of different approaches for developing standards and guidelines for best practice with respect to the use of indicators for assessing how well ecosystems are doing, focused on careful communication of indicators, their use and the information they are able to synthesize.

Useful web links:
About the author
Bill Dennison

Dr. Bill Dennison is a Professor of Marine Science and Interim President at the University of Maryland Center for Environmental Science (UMCES).
Next Post > One Planet One Ocean conference in Barcelona, Spain
Comments
-
Atika 7 months ago
Thank you for sharing this information with us, i really appreciate your post!