Over the river and through the woods to release the Upper Potomac Headwaters Report Card, we go!
Suzanne Webster ·Last December 10, 2015, Bill, Vanessa, Dylan, and I traveled to the University of Maryland Center for Environmental Science Appalachian Laboratory in Frostburg, MD to release our new Upper Potomac Headwaters Report Card. This report card assessed stream health in the Upper Potomac Headwaters region upstream of Harpers Ferry, WV, and was developed as part of a new graduate class in the Marine Estuarine Environmental Sciences program within UMCES. The class, “Scientific Basis for a Chesapeake Headwaters Report Card,” was taught in the Fall 2015 semester by professors Bill Dennison, Eric Davidson, Bob Hilderbrand, and Andrew Elmore. We used GoToMeeting, an online video conferencing software, which allowed students and faculty members to gather in a virtual classroom once or twice a week from all across the state.
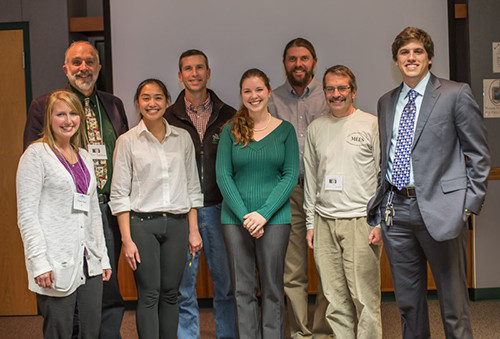
Vanessa Vargas and I, along with two other PhD students, Jake Hagedorn and Stephanie Siemek, worked very hard throughout the semester to develop the report card, with the input of our professors and the helpful advice of several invited guest lecturers from various agencies. We followed IAN’s report card process, beginning by defining our study region and sub-regions in the first days of our class. We then invited several guest lecturers to join us on our weekly conference calls, and learned about the rich history of the land and how it has changed over time, and also about how the local people use and relate to their landscape. Towards the end of the semester, after consulting with local experts and assessing data availability, we selected indicators of stream health from a long list of brainstormed possibilities, based on their relevance to the region and the degree of data availability.
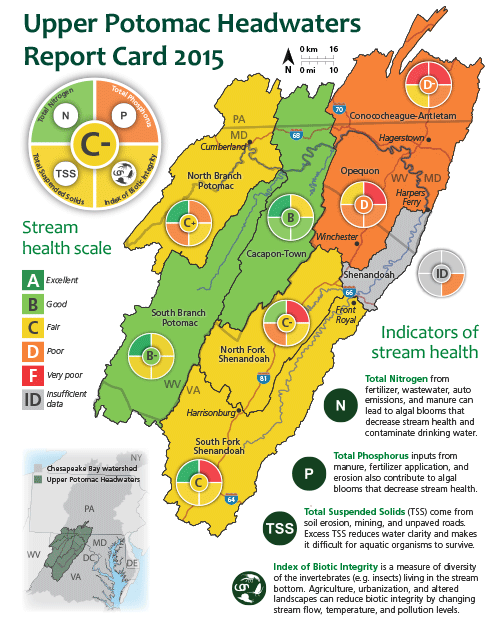
We then defined scoring thresholds for each of these indicators by consulting the available scientific literature and calculated grades for each sub-region and for the overall Upper Potomac Headwaters area. Over the course of the semester, we created several figures- maps, graphs, a conceptual diagram, and other images- that would help us communicate our results to an outside audience. We designed and produced a four-page report card and prepared and practiced an accompanying
45-minute talk.
On December 10th, the date of the release, Vanessa and I met up with Bill and our “videographer” Dylan in College Park and we all carpooled to Frostburg. We were able to squeeze in one last “dress rehearsal” conference call with our colleagues in Frostburg from the road, before driving deeper into the mountains and losing our internet hotspot connectivity.
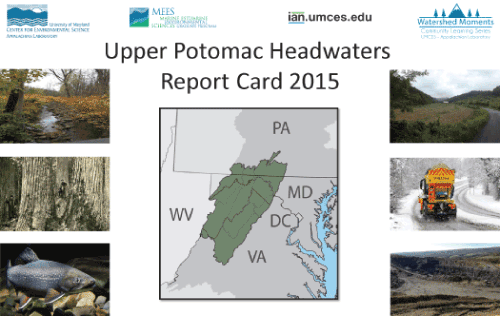
We arrived at the Appalachian Lab and Stephanie gave us a tour of the facilities, showing us all of the cool equipment and lab space that is available for graduate students’ use. Before we began our talk, we attended a catered reception and an art exhibition in the front entryway and lobby, which featured the work of local photographer, Jennifer Amendolara, and her elementary and middle school-aged photography students. The students were on “special assignment” for the lab to compose creative photographs of the Upper Potomac Watershed that beautifully complimented our presentation. The reception, art exhibition, and presentation were all part of a larger event called “A is for Art: An Upper Potomac Report Card and Exhibition,” which was the third public event in the Appalachian Lab’s new Watershed Moments Community Learning Series.
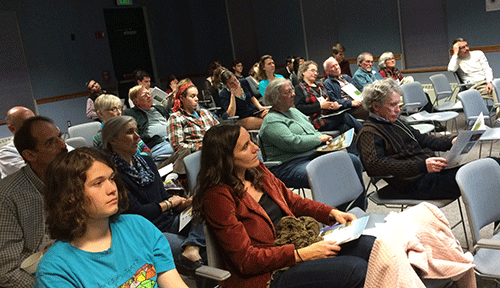
When it was time for our presentation to begin, Stephanie started us off by defining the reporting region and providing historical and geographical context for the report card. She also showed the audience a map depicting current land use patterns, explaining that the area remains heavily forested but features an agricultural belt and development along Interstate 81. Vanessa then discussed the economic significance of agriculture in the region and walked us through a conceptual diagram depicting three major threats to the ecosystem- agriculture and poultry production, mining, and development.
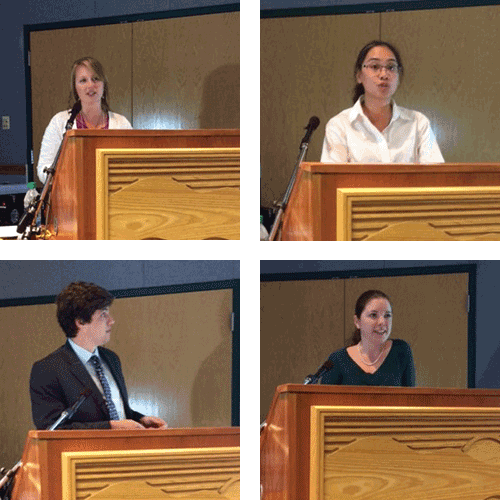
Jake followed with a discussion of how we selected our indicators (Total Nitrogen, Total Phosphorus, Total Suspended Solids, and Index of Biotic Integrity), an explanation of our grading methodology, and an overview of the final subregion and overall scores. The Upper Potomac Headwaters region scored a “C-“ overall and we noted a distinguishable negative impact to the stream water quality as a result of runoff from agriculture and poultry production, runoff from mining operations, and runoff from cities and towns. I concluded the presentation with a discussion of how we might address some of the ecological problems and provided suggestions for how we as individuals and communities might work to improve future grades. Finally, we passed out printed copies of the report card to our audience members and held a question and answer session. The report card was well-received and many of the audience members shared thoughtful comments and expressed that they were very impressed that we were able to put such a useful and comprehensive product together in such a short time.
The evening ended at Guisseppe’s Italian Restaurant in downtown Frostburg, where most of us were able to join to enjoy some beer and appetizers in celebration of a successful release and a very productive semester.
About the author
Suzanne Webster

Suzi Webster is a PhD Candidate at UMCES. Suzi's dissertation research investigates stakeholder perspectives on how citizen science can contribute to scientific research that informs collaborative and innovative environmental management decisions. Her work provides evidence-based recommendations for expanded public engagement in environmental science and management in the Chesapeake Bay and beyond. Suzi is currently a Knauss Marine Policy Fellow, and she works in NOAA’s Technology Partnerships Office as their first Stakeholder Engagement and Communications Specialist.
Previously, Suzi worked as a Graduate Assistant at IAN for six years. During her time at IAN, she contributed to various communications products, led an effort to create a citizen science monitoring program, and assisted in developing and teaching a variety of graduate- and professional-level courses relating to environmental management, science communication, and interdisciplinary environmental research. Before joining IAN, Suzi worked as a research assistant at the Marine Biological Laboratory in Woods Hole, MA and received a B.S. in Biology and Anthropology from the University of Notre Dame.