Conceptual Diagrams: Turning Science into Graphic Art
Katie Goerger ·Katie Goerger
“I’m just not sure how to get this concept across to people - it’s so complicated.”
“This publication is just too text-heavy. We need some visuals to spice things up.”
Does this sound familiar? If so, you’re missing a key tool in your science communication arsenal: the conceptual diagram.
We may not all be graphic artists, and we may not yet be familiar with using Adobe Illustrator, but studies show that 90% of information transmitted to the brain is visual. Therefore we would be omitting an extremely useful tool by not learning how to properly utilize conceptual diagrams.
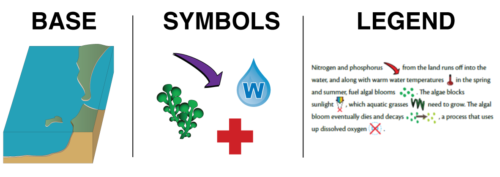
But what is a conceptual diagram? Essentially, it is a diagram that uses a base, symbols, and a legend to depict the essential attributes of a system. They help clarify thinking, aid in communication, and help the audience connect to a concept – engaging that visually-engaged 90% of the brain.

Such diagrams can be used in a myriad of ways including as an interface between scientists and the public, to illustrate complex processes, to communicate ecosystem relationships, to demonstrate comparisons, to describe processes at different scales…and more!
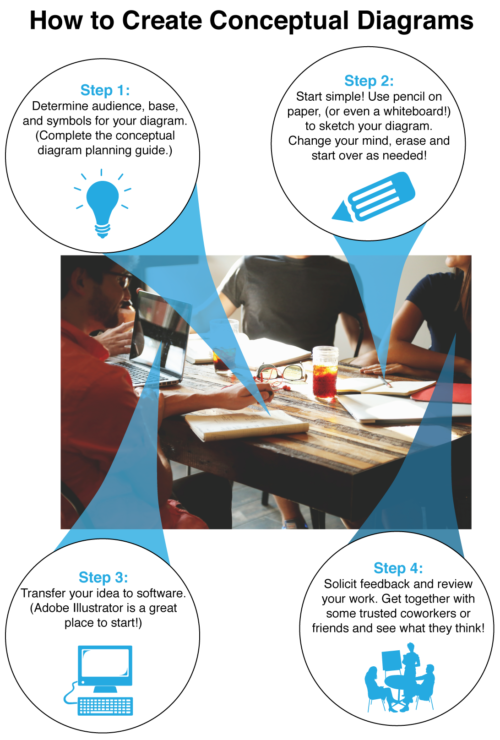
So how exactly do we create a diagram? There are 4 simple steps as illustrated in the diagram below.

Perhaps the most important step here is the first. Make the big decisions. Choose your concept and then flesh it out in the following steps:
- Identify your audience and medium you will use.
- Who will your conceptual diagram be aimed at? The public, scientists, legislators? This will determine the complexity and detail put into your diagram as well as the terms and language used.
- Where will this diagram be used? In a publication? On the web? In a presentation?
- Develop an issue statement for your title.
- What is your message? This is your first shot at getting it across to your audience. Start strong and pull them in!
- Prioritize the key features of the diagram.
- What are the major elements that are needed to get this concept across? Keep it simple and include only the relevant features. Including too much can cause you to lose your audience in a mess of symbols.
- Identify and prioritize the major drivers in your concept.
- What is moving this concept forward? What is absolutely necessary for the understanding of this concept? Whittle down the features from step 3 and focus on these as the “major drivers”.
- Develop a short list of symbols you will use.
- What symbols will be represented the key features / drivers of your concept? Collect these symbols together and, if needed, fill in the blanks with your own (if you’re feeling creative!)
- Choose an ecosystem base and style to start with.
- Is your concept best illustrated in a 2D cross-section? In a 3D landscape? Choose an ecosystem that will assist in telling your story by selecting appropriate landscapes, water bodies, geographic formations, etc.
Look to the PDF “Creating Conceptual Diagrams: A worksheet and guide” for assistance with this step – it is linked on the class Facebook page and will guide you through identifying your audience as well as provide excellent examples to work from.
After completing step one, you may find yourself wanting to leap onto illustrator and start designing! But hold up!
First, sit down and sketch out your ideas on paper (or even a whiteboard)! It doesn’t have to be pretty, but it will save you tons of time. It’s much simpler to draw some stick figures, hills and rivers on paper – only to erase them - than it is to spend your time designing something in illustrator and have to “undo” your way back to the beginning when you’ve changed your mind.

Then finally, once your idea is drafted and designed in illustrator, get some outside input! Go to a trusted coworker or friend and get their impressions. You never know what gems can come from some collaborative discussion!
These simple steps can help you work your way to designing something that can collectively enhance your work. Whether you’re an artist or not – give it a go! With a little work, you’ll have a diagram that will be useful in scientific publications, newsletters, on social media and more!

Next Post > Combating climate change in the floating city
Comments
-
Hanzhi Lin 8 years ago
Katie seemed to know what a reader is worried about when thinking of the conceptual diagram. The initial ABT did released my tensions on drawing a CD. Then Katie introduced almost everything of CD in the subsequent paragraphs. Actually I'm following Katie's blog to my homework this week --- I know it's already late :-( but better late than never...
-
Kristie Gianopulos 8 years ago
Nice job; very clearly written.
-
Michelle Canick 8 years ago
The reminder to start simple and sketch on paper (or a whiteboard - I think I'll try this next time) is spot on. Since I have no artistic ability and generally enjoy playing around with software, I was eager to dive into Illustrator. But this exercise made me realize the value of getting your ideas roughed out first.
-
Atika 5 months ago
Thank you for sharing this great information with us, i really appreciate your post!