UMCES active in the 2016 River Symposium in Delhi, India
Heath Kelsey ·The 19th annual River Symposium was held in Delhi, India this year - the first time it's been held outside of Australia. I had a chance to attend, and to present a couple of talks related to the partnership we have with WWF for the Basin Report Cards Initiative. The highlight for me was the special session we co-hosted with WWF to demonstrate the Report Card Game on Wednesday afternoon to close out the meeting. We had about 30 participants, and it was a lively and boisterous session. The game has been on something of a world tour, with the first demonstration at World Water Week in Stockholm, Sweden in early September, the IUCN World Congress in Hawaii the following week, and finally at River Symposium.
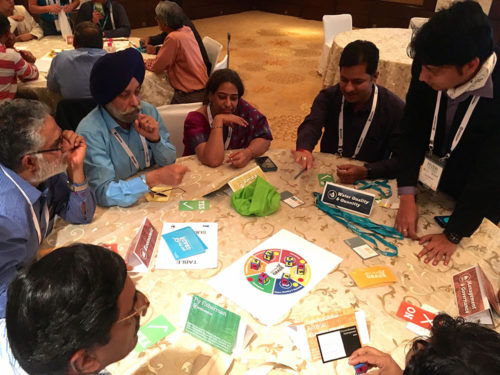
The game is a fun, interactive way to see how good information at your fingertips can help make informed decisions about management in your watershed. Each player is assigned a different role as a stakeholder in a fictitious basin - a basin that has previously gone through the engaging process of developing a basin health report card. The initial condition for each value area is set at random by rolling a die that has red, green, and blue sides, and then situations arise, described on cards that each participant chooses on their turn. The cards describe a situation that must be managed - either a vote by the whole community on something like a new aquaculture scheme, or an event that affects all stakeholders. Scores for each goal are recorded and displayed in a dynamic "Report Card" for all to see. Each basin competes for the highest overall score.
The session was a lot of fun, and I think most of the participants had a better understanding of how a report cards can help make informed decisions.
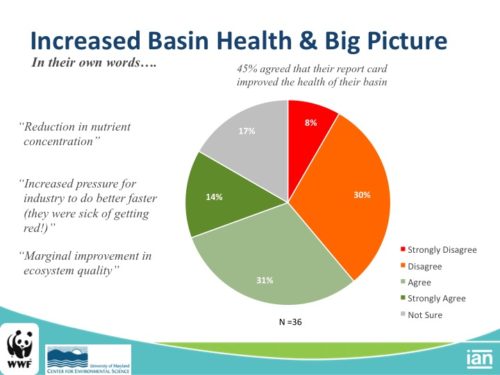
I also presented a talk on the Guidance document that we are preparing for developing report cards, which is designed to provide, to anyone who wants it, the skills and understanding necessary to go through the entire process of creating a report card. We also had some great statistics to show on the survey we did of previous report card developers. Survey results suggest that report cards are versatile tools with strengths in awareness and education of environmental issues, but with additional utility for decisions in resource allocation, and in restoration decision-making. These results were very encouraging, and reinforce the idea that report cards have real potential to make positive change.
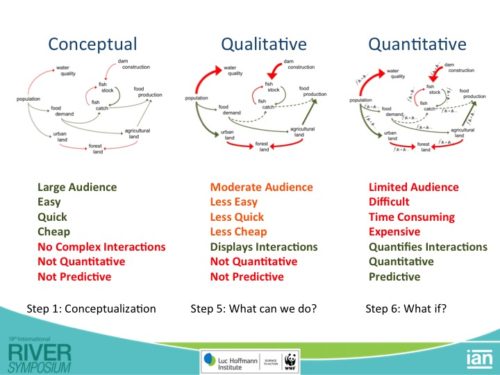
My last talk was on the hopeful idea that Systems Dynamics Modeling can be used effectively in conjunction with the report card process. Systems Dynamics Modeling attempts to quantify the relationships between the numerous and varied factors that influence each other. By quantifying these relationships, the effect of changing one factor can be measured in all the other factors dynamically. We hope that these models can be used to develop scenarios that can be reflected in report cards scores. Perhaps more importantly, the initial process of creating a systems dynamics model involves an interactive process to develop a conceptualization of the entire system, called a "Causal Loop Diagram." This diagram illustrates the linkages between the various elements in the system. We hope that the process of developing a systems dynamic model can be useful in the conceptualization phase of report card development, perhaps leading developers to the most impactful indicators. The process of developing a systems dynamic model is also iterative - after the conceptualization phase, the model can be further developed with qualitative relationship descriptions, that we hope can lead to recommendations for conservation of restoration that are relevant, and can have substantial impact. Lastly, if the model is fully developed, it will be useful in creating complete scenarios that estimate quantitative results based on changes to one or more indicators or values. Recommendations generated from this process could be very useful in holistic watershed planning.
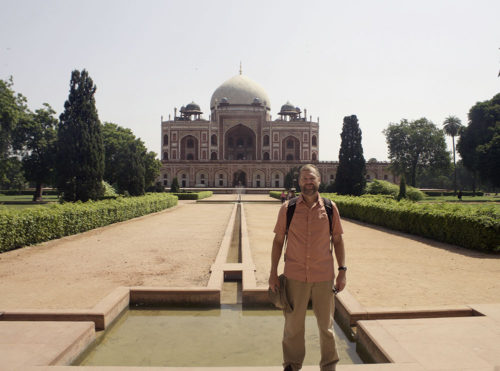
The other parts of the annual pilgrimage to River Symposium were also very nice - the meet up with old friends, making new ones, and general good cheer. The venue was great too - the Taj Palace Hotel in New Delhi is indeed a palace - evoking colonial comfort and overwhelming service. I also had a brief chance to get out and about - Michele Thieme and I snuck half a day prior to the conference to see to Humayan's Tomb, built in the mid-1500's and inspiring the Taj Mahal. All in all a fantastic conference and a good showing for the WWF - UMCES partnership.
About the author
Heath Kelsey
Heath Kelsey has been with IAN since 2009, as a Science Integrator, Program Manager, and as Director since 2019. His work focuses on helping communities become more engaged in socio-environmental decision making. He has over 10-years of experience in stakeholder engagement, environmental and public health assessment, indicator development, and science communication. He has led numerous ecosystem health and socio-environmental health report card projects globally, in Australia, India, the South Pacific, Africa, and throughout the US. Dr. Kelsey received his MSPH (2000) and PhD (2006) from The University of South Carolina Arnold School of Public Health. He is a graduate of St Mary’s College of Maryland (1988). He was also a Peace Corps Volunteer in Papua New Guinea from 1995-1998.