Evolving ecosystem health report cards to address issues of scale, acceptance, engagement, and behavior change
Heath Kelsey · 
At the recent commOcean2016 conference in Bruges, Belgium, I attended a short discussion session on effective science communication tools and strategies. Although the conversation was not exactly brisk, there was one exchange that triggered a new direction in my thinking about science communication, behavior change, and ecosystem health report cards.
During the discussion, there was some pointed disagreement about the best way to achieve positive change. One view promoted co-design and development in research as a means of changing overall attitudes about important issues, but a fiery response suggested that simply telling people what actions they can take is what people really want. In reality, both of these strategies (and many others) are necessary, because people are at different stages of acceptance of the views we promote. We need practices that can speak to people across the spectrum of acceptance of our messages.
Ecosystem health report cards can provide relevant information for multiple audiences
There is a behavior change concept attributed to Nancy Lee, that groups people based on their attitude about a particular desired behavior (like fertilizing less). She talks about three groups – the “Help Mes,” the “Show Mes”, and the “Make Mes.” The Help Mes are already fertilizing their lawns less, but could use some kudos or additional help to make it easier (guidance on the best timing, application rates, etc.), the Show Mes would do it if they only knew what was necessary (these folks might have a vague understanding that less fertilizer is better for the bay, but do not really know much about how to fertilize less and still have a green lawn), and the Make Mes won’t change their fertilizer application habits unless they are forced by some rule, regulation, or fine (like no longer being able to purchase fertilizers with Phosphorus for instance). The assumption is that the Show Mes are where we can have the biggest impact – they are assumed to be the biggest portion of the population, are variously open to change, and may only need to know what to do.
At IAN, we further divide the groups into five, adding the “Follow Mes” and the “Convince Mes” (Figure 2). The Follow Mes are not just doing the desired behavior, they are real leaders – promoting the idea and demonstrating how to do it. The Convince Mes are similar to the Show Mes, but are a little more skeptical and may need a bit more convincing to get on board.
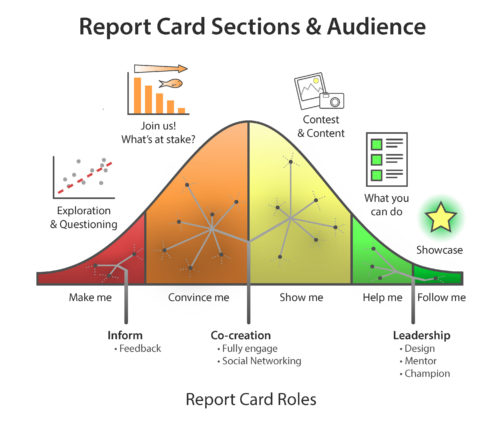
We design our report cards to provide relevant information for broad audiences, but I had never considered how discrete sections or portions of the content could be targeted to each of these groups. Thinking this through, many of the report cards we’ve been involved with have elements that could speak to each of these groups. As our thinking about report cards has grown to include active stakeholder participation, I think this has allowed us to reach the Show Mes and Convince Mes. Figure 2 shows the five groups, what parts of the report card that can be targeted to their needs, and the roles each group might play in the report card development process.
Report cards can be structured to address audiences that have varied degrees of acceptance
Every report card IAN releases should contain five sections which directly address the concerns and needs of these population groups. We have included some of these sections in previous report cards, but no report card has all five of them.
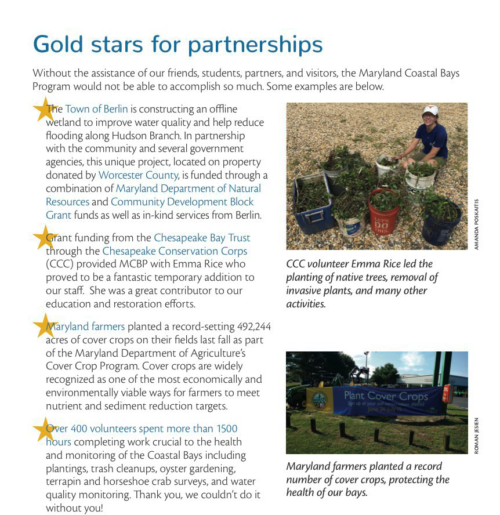
- The “What the leaders are doing” section highlights groups that are taking leadership on particular issues. For example, the 2015 Coastal Bays Report Card listed six “Gold Star” programs that were taking leadership roles in on conservation and restoration. It is important to recognize the efforts of environmental leaders, and I think every report card should make an effort to do so.
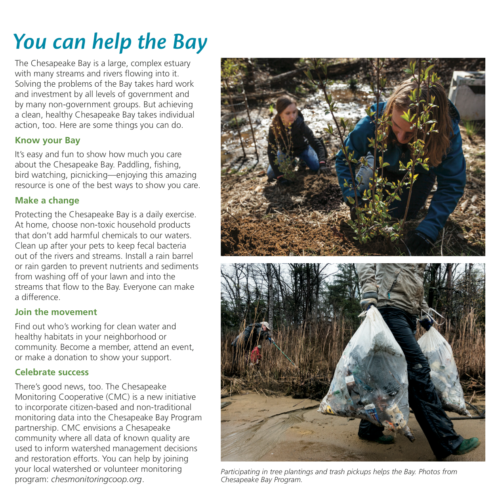
- The “What you can do!” section is also common, and details practical actions for homeowners that can make meaningful contributions to improving water and habitat quality. Several local report cards included this section as early as 2008; the first Chesapeake Bay Report Card to include this section was 2011. This section resonated strongly with report card audiences in a series of focus groups that were convened to find out what parts of a report card document were most effective in conveying intended messages. This section is what the second participant at the commOceans conference discussion was advocating for.
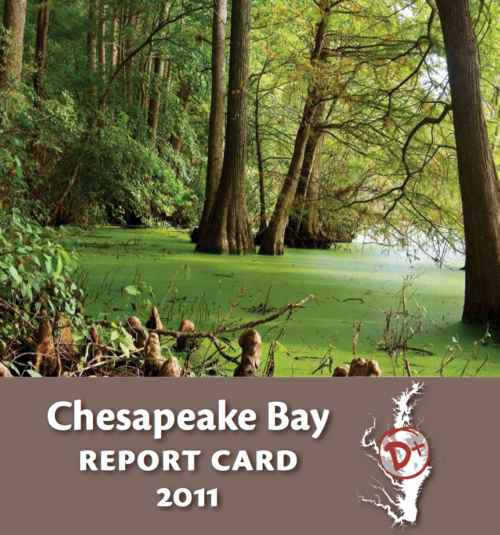
- The “What’s happening” Section enables stakeholders to take part in the development of the report card through either a contest or the solicitation of stories about the area. For example, the 2011 Chesapeake Bay Report Card had a contest to select the best photo for the front cover. Stories have been solicited and recorded during the development of some projects (the 2015 Mississippi River Watershed Report Card for example) which could be included in the report card. This section is relevant to those who are sympathetic to some of the report card’s goals, but need a little incentive to get involved.
- The “What’s at Stake?” section is meant to highlight the importance of the system and what it means to people’s values -- why do we care about this system, why do we need a report card, and why do we need to do anything? This section is meant to convince folks of the need to protect, restore, or enhance the ecosystem. Many of the report cards we produce currently have a section like this.
- The “What’s going on here?” section is meant to provide probing questions targeted to the Make Me group, who are not currently receptive to our message and are difficult to connect with. By providing opportunities to explore, these folks may come to be more accepting over time, especially if societal norms change enough to make the message more mainstream.
The report card development process can help reach the biggest pool of stakeholders
Our process of developing report cards has evolved over the years, coming to focus more heavily on stakeholder engagement. This increases the acceptance of the report cards as a tool, and helps develop really important (but less tangible) elements like creating a shared vision for the region. This vision is powerful because it is developed by stakeholders with a wide variety of perspectives, using a common language and set of measurements, which are all key elements of a collective action approach to social change.
We should also adjust our report card development process to engage each of these stakeholder groups.
- Follow Mes and Help Mes can be actively recruited to lead parts of the development process. These folks may already be leaders in conservation, stewardship, and management, and are likely to be respected among their peers. Their engagement and leadership in the report card development process will not only highlight their activities, it will also serve as a good endorsement of the report card.
- The Convince Mes and the Show Mes are the most important group to bring into the development process. Having them as part of the process increases the likelihood that they can be “converted” into people who understand and now endorse the report card idea. In short, we want these folks to “Get It”, so that they can distribute it to their peers. We feel that having a large number of people in this category as part of the report card development process greatly increases the societal acceptance of the end product and will increase its impact.
- The Make Mes are also important to include. They represent hard-core skeptics which may be unlikely to be converted in the process, but full inclusion demonstrates that the process was open, even to those with opposing views. At the very least, inclusion may soften opposition by inclusion in the development process.
Thanks to Vanessa Vargas, James Currie and Emily Nastase for their big contributions to this blog.
About the author
Heath Kelsey
Heath Kelsey has been with IAN since 2009, as a Science Integrator, Program Manager, and as Director since 2019. His work focuses on helping communities become more engaged in socio-environmental decision making. He has over 10-years of experience in stakeholder engagement, environmental and public health assessment, indicator development, and science communication. He has led numerous ecosystem health and socio-environmental health report card projects globally, in Australia, India, the South Pacific, Africa, and throughout the US. Dr. Kelsey received his MSPH (2000) and PhD (2006) from The University of South Carolina Arnold School of Public Health. He is a graduate of St Mary’s College of Maryland (1988). He was also a Peace Corps Volunteer in Papua New Guinea from 1995-1998.
Next Post > Atlantic Estuarine Research Society meeting at St. Mary's College of Maryland
Comments
-
Chanda 6 years ago
Great and insightful blog Heath! Eye opening for me as we are about to embark on this process. No need to be afraid of the make mes/convince mes. All are welcome and important for the process.