Finalizing the Guanabara Bay Report Card
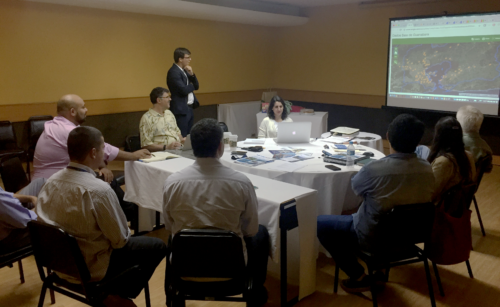
Alexandra Fries ·On April 24th, 2017, Dave Nemazie and I began our journey to Rio de Janeiro. Little did we know, instead of taking 18 hours to get there, it would take 30. We flew through JFK, and a delayed flight meant we missed our connection to Rio. After spending the day in New York, we finally arrived a day after we were supposed to. Despite our travel woes, we made it to Rio and had productive meetings with our partners, Guido Gelli and Marlus Newton.

The purpose of the meeting was to finalize the Guanabara Bay Report Card, including the website, communication plan, science conference, and public release event. We held our meetings at the Windsor Guanabara Hotel, the same place we always stay in Rio de Janeiro. We also took almost all of our meals at the hotel to save time, so I barely saw any of Rio on this trip. While going to get some Brazilian money from the ATM, I did see an interesting sight. People were boarding up the glass windows and doors of the banks. A strike was on the way.
Toward the end of our second full day of meetings on April 27th, we heard increasing chatter and news about the strike, which was building into a country-wide issue. There was news of roads closing, no public transportation, no taxis, and even mention of the airport being closed. We were supposed to be leaving on Friday evening, but since that was the day of the strike, and we had already completed all of the items on our agenda, we decided to get out of town as soon as possible.

I had a personal trip planned for after the meetings to visit Foz do Iguaçu, and Iguazu Falls at the border of Brazil, Argentina, and Paraguay. I changed my flight and headed down to Iguaçu that night.
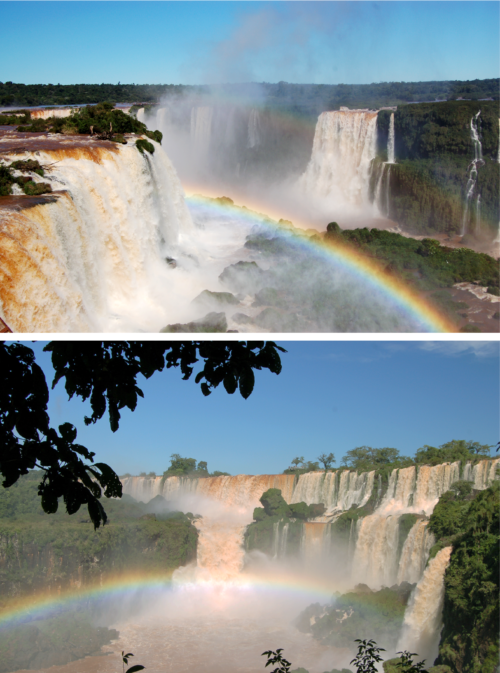
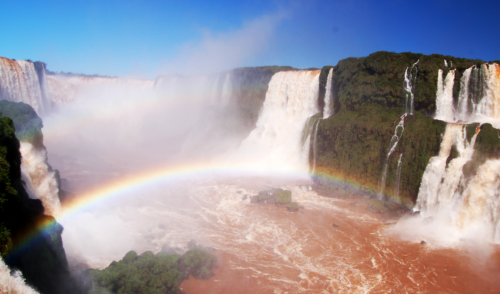
Iguazu Falls are the largest waterfalls system in the world, with 150-300 waterfalls making up the system depending on water level. The waterfalls range in height from 197 to 269 feet. For comparison, Niagara is only 165 feet in height. The flow rate of Iguazu Falls is only 6th in the world, at 1746m3/s. I visited both the Brazilian and Argentinian sides of the falls, which were each unique and gave different perspectives of the falls.

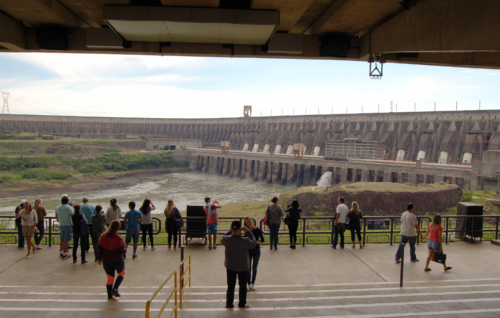
On my last day in the region, I visited the largest hydropower dam in the world, Itaipu. It produced 103,098,366 megawatt hours in 2016, even more power than the Three Gorges Dam in China. It is located on the border of Paraguay and Brazil, and the dam crosses the border. It is on the Parana River, which during construction of the dam, was rerouted by moving 50 million tons of rock and earth. Seeing the dam was impressive, but also sad, as I read later that the creation of the dam and its reservoir encompassed Guaira Falls, at the time (1982) one of the largest falls in the world.

Overall, this trip to Brazil was difficult travel-wise, with many flight woes, but also excellently productive to help finalize the Guanabara Bay Report Card. We are hoping to release the report card in July 2017. And I was able to see a new place in Brazil, the Iguazu Falls, which is a UNESCO World Heritage Site and one of the New 7 Wonders of Nature.

About the author
Alexandra Fries

Alexandra is a Program Manager at the Integration and Application Network (IAN) based at the University of Maryland Center for Environmental Science in Annapolis MD. Alexandra’s work in environmental management has been focused on assessment, monitoring, and management of aquatic, marine, and terrestrial ecosystems. Alexandra has extensive experience in data analysis, synthesis, mapping, interpretation, and communication. Alexandra has experience working with a diverse group of partners including those in local, state, and federal government, non-governmental organizations, non-profit organizations, private industry, and academia. Within IAN, Alexandra conducts data analysis, synthesis, and communication by completing environmental report cards, updating the IAN website, and conducting science communication courses. Alexandra also creates science communication materials such as diagrams, posters, presentations, newsletters, and reports using Adobe Creative Suite, Microsoft Office Suite, and ArcGIS. Alexandra has experience managing projects and staff on local and international projects, liaising directly with partners and colleagues, and providing insights on project direction and goals.
Next Post > More lessons on how to synthesize science
Comments
-
Thales Pırlanta 7 years ago
Your research is very valuable to us. Thank you very much.