Grading basin or ecosystem health to track and address change
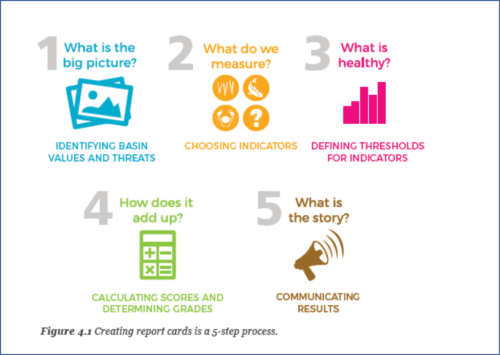
Irina Ize ·This week, Healthy Rivers for All course participants turned our attention to Step 4 in the 5-step report card process, discussing how to calculate scores and determine grades.
The goal of this step is to combine all the information provided by very different indicators and “roll it up” into a single grade, which can then be communicated to decision makers and more easily understood by the general public. The assigned score becomes a useful piece of information that can improve decision making and empower society in its engagement in ecosystem care.

During this week's class session, we had a very interesting discussion about the difficulties that can arise when stakeholders are unwilling to support the open information sharing process needed to assign a score to a basin, river, or ecosystem. These difficulties can be overcome by engaging hard-won stakeholders with the help of supportive peers who are convinced of the usefulness of a Report Card. Also, collaborative stakeholder activities can pique interest and create shared experiences that establish a working team feeling among people who have different interests but share a common environment.
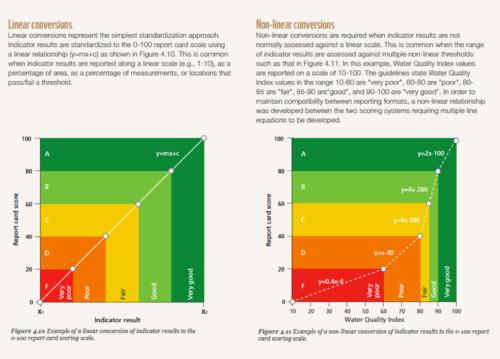
The lecture for this week’s session featured a discussion on how to convert indicator results into a percentage scale with a simple F to A scoring system. Linear and non-linear conversions might be needed, as explained in the Practitioner’s Guide to Developing River Basin Report Cards.

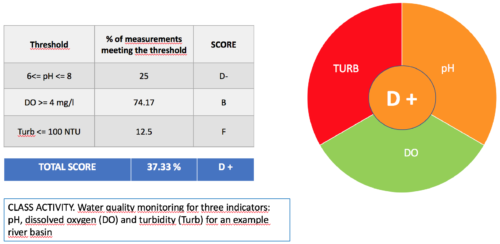
As a class activity, students calculated an overall score for the water quality of an example river basin using a provided data set of monthly data collected for a year on indicators for turbidity, pH, and dissolved oxygen. Most participants calculated the overall score by using the whole set of measurements to come up with a D+ grade because no details were provided about the river system that indicated that it should be studied in different parts. However, a river basin could be graded in separated parts, such as river segments upstream and downstream from a sewage treatment plant, salt and fresh water sections of an estuary, stream stretches upstream or downstream from a physical boundary (waterfall), or areas within various government jurisdiction boundaries. This issue of dividing reporting regions is of particular importance for international transboundary water management, as presented in the Using indicators for improved water resources management guide.

Our colleague, Katya, pertinently pointed out that the results of the activity could be diametrically different if the data set was analyzed with a different approach, such as using monthly or site-based means or medians. This observation raised the question of how we can analyze data so it “tells the story that needs to be told” in a report card, while still honoring our ethical responsibility of objectivity when it comes to presenting scientific information. The methods used to calculate scores and “roll-up” to an overall score need to be clear and transparent, as well as defensible and replicable. A report card needs to always be accompanied by readily available additional information detailing the grading method used, which can be presented in the form of a white paper or contained on a website.
This ethical issue is one of the key issues in report card production, as the whole process is always a blending of subjective and objective information starting from the stakeholder invitations and participation choices, the indicator suitability discussions, the decision of what thresholds to use, and finally the overall score calculation. Transparency and responsibility become pivotal in the whole process in order to support collaborative environmental problem solving.
The objective at the end is to come up with an honest score that really tells the “story that needs to be told” for a particular watershed, river, basin, or ecosystem—one that the stakeholders working on conservation and sustainability are comfortable with—in order to achieve the desired level of protection and proactive decision making. This is a real challenge for effective science communication through a report card.
References
1. Bertule, M., Bjørnsen, P.K., Costanzo, S.D., Escurra, J., Freeman, S., Gallagher, L., Kelsey, R.H. and Vollmer, D. (2017). Using indicators for improved water resources management – guide for basin managers and practitioners. 82 pp. ISBN 978-87-90634-05-6.
2. Costanzo, S.D., Blancard, C., Davidson, S., Dennison, W.C., Escurra, J., Freeman, S., Fries, A., Kelsey, R.H., Krchnak, K., Sherman, J., Thieme, M. Vargas-Nguyen, V. (2017). Practitioner’s Guide to Developing River Basin Report Cards. IAN Press. Cambridge MD USA.
3. Longstaff B., Carruthers T.J.B., Dennison W.C., Lookingbill T.R., Hawkey J.M., Thomas J.E., Wicks E.C., Woerner J. Integrating and Applying Science. A practical handbook for effective coastal ecosystem assessment. (2010) IAN press. ISBN 978-0-9822305-2-7
Next Post > The Science of Science Communication
Comments
-
Ximena 6 years ago
Very good summary of what we saw last week. Very good visuals.
-
Katya Altman 6 years ago
Excellent job, Irina!
-
Katya Altman 6 years ago
This is a great summary of the last week’s discussion, useful links and visuals. Thank you for highlighting the importance and ethical issues of transparency and responsibility in the report card process.
-
Nancy Sheehan 6 years ago
Great summary of our discussion. Thank you for emphasizing the importance of transparency and continued stakeholder engagement throughout the report card development process. You also provided useful links. I have already shared widely the "Talking Science" youtube video with colleagues.
-
Kennedy 6 years ago
Great summary with useful links for more info. Thanks Irina
-
Atika 7 months ago
Thank you for sharing this great information with us, i really appreciate your post!