

Video & Blog Highlights
- Emily Majcher, of USGS, presented the latest Science for Citizens seminar titled "Monitoring, Modeling, and Research as part of the Baltimore Urban Waters Initiative". A video recording of the seminar can be viewed on IAN's website or on YouTube.
- Talking report cards in Kratie, Cambodia
- Mission Aransas Pilot Project
- The great equalizer: Using the web to communicate science
Chesapeake Bay receives a score of C in 2016
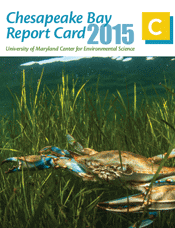 The Chesapeake Bay received a C grade in the 2015 UMCES Chesapeake Bay Report Card, which was released May 17 at the Annapolis Maritime Museum. 2015 marks the 10th anniversary of the UMCES Chesapeake Bay Report Card. The score of 53 was the highest since 2002, and the third highest score since they've been calculated. This is despite near normal rainfall and high agricultural production in the watershed. The most important increases in scores were in nitrogen, water clarity, and aquatic grasses. Improvements in Bay health are Bay-wide; scores in almost every reporting region improved from 2014 to 2015.
Chesapeake Bay Program's Creative Team hosts WebStock 2016
 This month, the Chesapeake Bay Program Creative Team hosted a one-day symposium on all things web for an audience of friends and colleagues. Known as WebStock, the annual event was revitalized last spring as a way for the Creative Team to introduce others to the work they do and the methods they use to do it. Indeed, participants gained an understanding of how the Creative Team can help them and how they can use the team's own tools and processes to improve their work. As we closed the event by sharing what we learned, two themes rose to the top: the amount of thought that goes into creating great work and the importance of working with a cross-functional team.
First semester-long course in Science Visualization completed
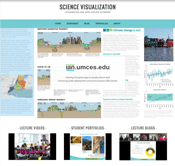 This spring IAN offered a new course in Science Visualization through the Marine-Estuarine Environmental Science graduate program of the University System of Maryland. The class utilized a 'flipped' or 'inverted' classroom in which lecture content was provided before class time via YouTube videos. Class period was used for discussion and review of student's work. The course generated 18 video lectures/tutorials, 13 blog posts and a course website in which all of the videos, blogs, and student portfolios are available. Planned future iterations of the course will be offered to our collaborators in the NGO community and partner agencies.
In March 2016, a deadly sequence of events results in a record fish kill in Indian River Lagoon
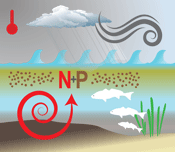 During the project to create the first Indian River Lagoon (IRL) ecosystem health Report Card with the Marine Resource Council (MRC), a massive fish kill exploded in some of the central and northern IRL lagoons in March 2016. Jane Hawkey and Heath Kelsey created a one-page flyer that focused on the brown algae bloom that appears to have caused the death of large numbers of fish and other marine species. While there is more to be learned, a particular sequence of events appears to have led up to the deadly event and is represented in the three conceptual diagrams – one of which is shown here. The flyer was made available to the interested public at the recent MRC LagoonFest 2016 event held in Palm Bay, FL. The State of the Indian River Lagoon report card is projected to be distributed in 2017.