

Comparing septic and sewage systems
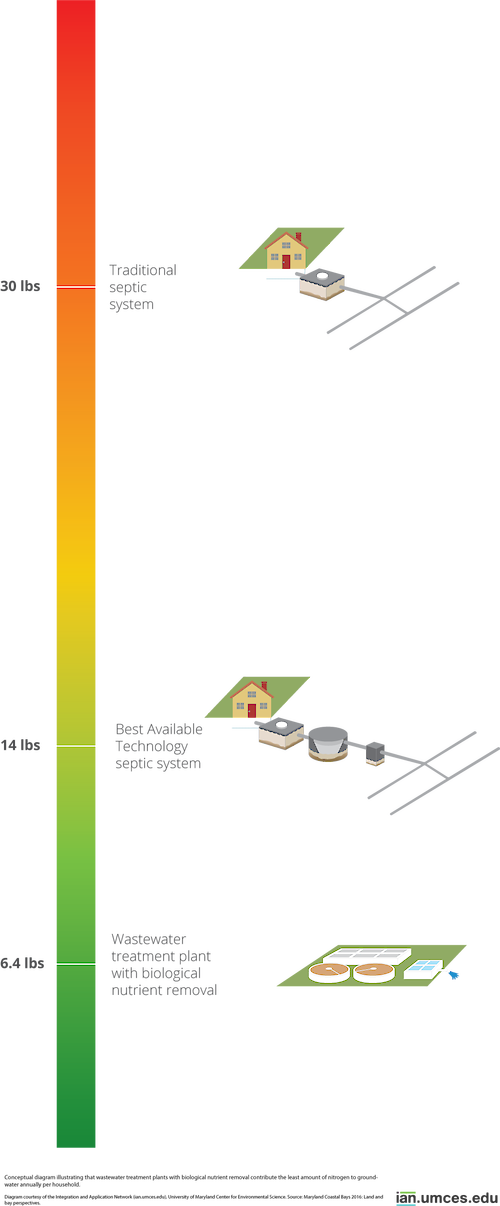
Conceptual diagram illustrating that wastewater treatment plants with biological nutrient removal contribute the least amount of nitrogen to groundwater annually per household.
diagram septic sewage nitrogen house treatment plant| Author(s) | Jane Thomas |
| Author Company | Integration and Application Network |
| Date Created | 2016-07-01 |
| Album | Human > Development/Infrastructure |
| Type | Graphic |
| Publication | Maryland Coastal Bays 2016: Land and bay perspectives |
| Project(s) | Maryland Coastal Bays Science Communication Products and Report Cards |
| Dimensions | 1000 x 2411 |
| Filesize | 83.6 kB |
| Number of Downloads | 252 |
| Filetype(s) | PNG |
| License | Attribution-ShareAlike 4.0 International (CC BY-SA 4.0) |
| Required Attribution | Jane Thomas, Integration and Application Network (ian.umces.edu/media-library) |