

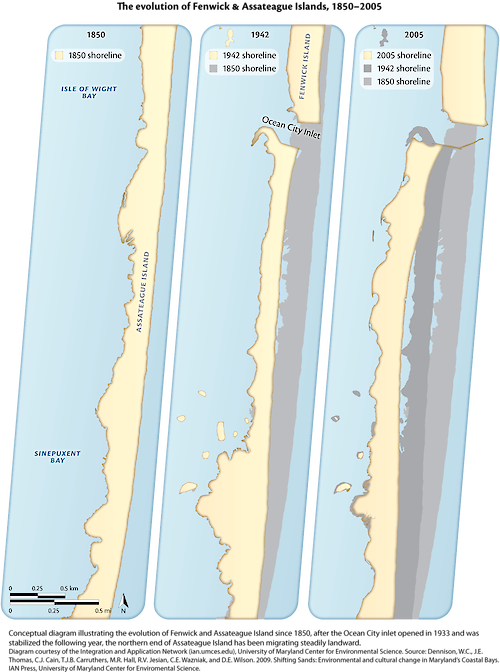
The evolution of Assateague Fenwick & Assateague Islands, 1850-2005
Conceptual diagram illustrating the shoreline change of Fenwick and Assateague Island since 1850.
diagram fenwick assateague migrationg dynamics inferferance sea-level| Property | Value |
|---|---|
| Author(s) | Jane Thomas |
| Author Company | Integration and Application Network |
| Date Created | 2009-01-01 |
| Album | Ecosystems > Coastal/Marine |
| Type | Graphic |
| Publication | Shifting Sands: Environmental and cultural change in Maryland's Coastal Bays |
| Project(s) | Maryland Coastal Bays Science Communication Products and Report Cards |
| Dimensions | 1000 x 1343 |
| Filesize | 355.3 kB |
| Number of Downloads | 365 |
| Filetype(s) | PNG |
| License | Attribution-ShareAlike 4.0 International (CC BY-SA 4.0) |
| Required Attribution | Jane Thomas, Integration and Application Network (ian.umces.edu/media-library) |