

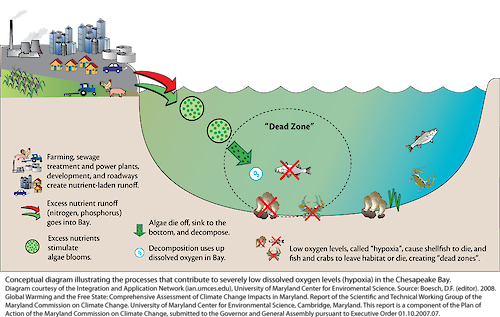
Hypoxia
Conceptual Diagram illustrating the process that creates low oxygen levels in an estuary.
diagram hypoxia oxygen global warming sea-level rise dead zone fish farming industry dissolved oxygen chesapeake bay| Property | Value |
|---|---|
| Author(s) | Jane Thomas |
| Author Company | Integration and Application Network |
| Date Created | 2008-01-01 |
| Album | Human > Environmental Degradation |
| Type | Graphic |
| Publication | Global Warming and the Free State: Comprehensive Assessment of Climate Change Impacts in Maryland |
| Dimensions | 1000 x 633 |
| Filesize | 227.2 kB |
| Number of Downloads | 632 |
| Filetype(s) | PNG |
| License | Attribution-ShareAlike 4.0 International (CC BY-SA 4.0) |
| Required Attribution | Jane Thomas, Integration and Application Network (ian.umces.edu/media-library) |