

Building a Report Card: Getting Started
Molly Ryan, Elsa Noreña ·Our "How to Make an Ecosystem Health Report Card" began this week with introductions from Dr. Bill Dennison and Dr. Heath Kelsey, our professors. They then asked that each of the participants introduce themselves and mention the place where they are from as well as the time and temperature in each of the locations. We are more than 20 participants from different regions in the world, with 15 hours difference in time zone, from 6 am in the Mexican Pacific to 9 pm in the Philippines; obviously many temperature differences there as well! The existence of two well-defined groups among the participants was highlighted, one group in Zambia and another in Yucatan, Mexico.
The class is being taught using the Zoom video conferencing app. Our instructors are Bill Dennison, Heath Kelsey, Simon Constanzo and Vanessa Vargas-Nguyen. The students attending include Kawawa Banda, SiuLing Cinco, Meki Chirwa, Charisa Ferrera, Sharon George, César Vázquez González, Joel Kabika, Chinyawezhi Kakoma, James Mbewe, Luis Méndez, Ricardo Merlos, Sara Morales, Chipo Gift Mubambe, Mathews Mulenga, Agness Musutu, Alice Nambeye, Namafe Namafe, Elsa Noreña, Javier RamÃrez, Andrea Rivera, Molly Ryan, Emmanuel Sakeyo, and Nuno Simoes. Regarding the dynamics of the course, the following was agreed: As much as possible, reading material and videos will be sent a week before, so that everyone has the opportunity to review it; the blog of each session will be published on Wednesdays; tasks and practical activities will be assigned to apply the concepts and procedures in the regions of interest of the participants.
-
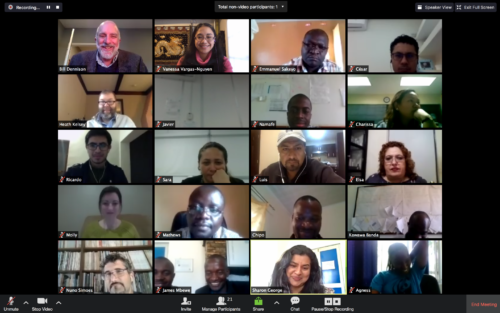
Screenshot of our first class showing participants from different parts of the world! Credit: Vanessa Vargas-Nguyen
We began our conversation this week by highlighting the fact that this is a "Practitioner's Course" and that we all should have the skills, knowledge and resources to be able to carry out the report card process by the end of this class. Building a report card is really a process, not just a result; from conceptualization to implementation, we are interested in how data is collected, why we might choose a certain indicator and what that indicator ultimately tells us about ecosystem health. This can take some time, and it is important to consider that preparing a report card in which all stakeholders participate can take 18 to 24 months.
So what does this process look like? Broadly, it resembles our environmental intelligence pyramid, building on data gathering, information generation, and knowledge building. Environmental intelligence is communicating good science effectively and in a timely manner; we want to be able to gather as much information as possible about an ecosystem, including social and economic aspects if possible, to be able to effectively determine and communicate to our communities and politicians how healthy that ecosystem is.
-
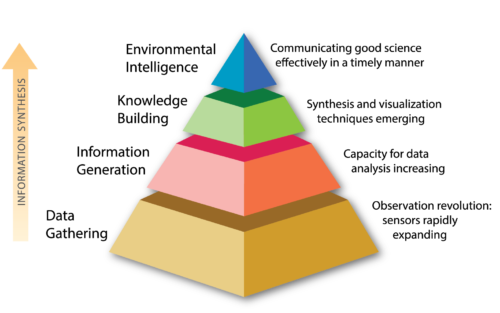
Environmental Intelligence Pyramid. Credit: Bill Dennison's video lecture
How do we communicate how healthy an ecosystem is? We use a grading scheme. The grading scheme refers to a score or "grade" that an ecosystem is given after we finalize data collection and digest or interpret the meaning behind it. Grading schemes can vary from place to place depending on how you choose to scale your grade. For example, some may choose to assign an "F" grade if their river ecosystem scores lower than 60% while others may choose to assign the same grade only if their ecosystem scores in the lowest 20%.
The way you choose to grade your ecosystem can vary so long as you make sure to keep your methods transparent and available to the public. It's very important that anyone who may pick up your report card can not only easily understand the layers of the report card and what they mean, but also see how much data went into the report card and why you chose a specific measurement or indicator. Communicating with the public is the most effective method for getting the attention of policy makers who ultimately may secure funding for future restoration projects and initiatives. Regardless of the variance between grading scales, one factor always remains the same when communicating with the public about the health of your ecosystem: using the color green on a report card indicates good health and likewise red indicates poor health. These colors remain universal no matter how you may choose to individually grade your local river ecosystem.
-
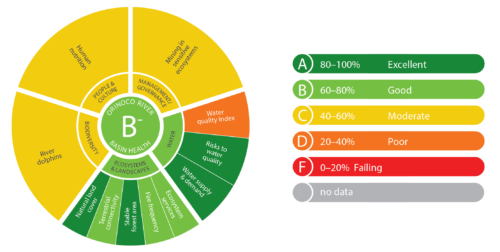
Grading schere for the Orinoco River Basin. Credit: Costanzo et. al. 2017. Practitioner's Guide to Developing River Basin Report Cards
Obviously, the process of creating a report card is highly variable and requires a lot of data input and analysis. How do we gather this data? Understanding the discrepancy between what information you may need to effectively evaluate a river ecosystem and what information you actually have access to is key in determining valuable indicators. It is often the case that we will not have immediate access to all of the data necessary to grade our river. This is a problem no matter if you are living in a developing or developed country. What should you do if you find yourself lacking the appropriate data? First, reach out to new stakeholders that you might not have contacted before. Stakeholders in the area may have information or data on your river ecosystem from previous projects or initiatives. Secondly, don't be afraid to invoke citizen science as a way to monitor your ecosystem! Engaging the community can help you to both collect necessary data and publicize your issues or goals.
Why else might citizen science be important? Having a large volume of people reporting on your ecosystem allows for us to monitor a wider variety of indicators on both a large and small scale. Small-scale indicators are just as important as large-scale indicators because they allow us to assess the fine details that we might otherwise miss. If you were to only assess a river based on large-scale indicators, you risk assigning your river an inaccurate grade.
-
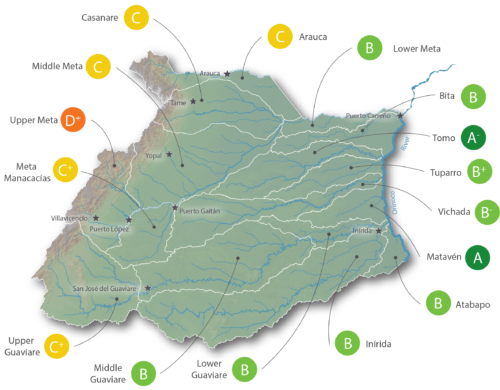
Individual grades were assigned to each part of the Orinoco River basin; without the whole picture, any assessment of the river basin health would be inaccurate. Credit: Costanzo et. al. 2017. Practitioner's Guide to Developing River Basin Report Cards
On the other hand, a broader spectrum of indicators is currently considered when building a report card. Incorporating socioeconomic aspects is something relatively recent and selecting indicators of this type is complicated. In this course, Vanessa will help us integrate the social aspects in the report cards and some examples can be observed in the Orinoco and Mississippi Basins report cards.
-
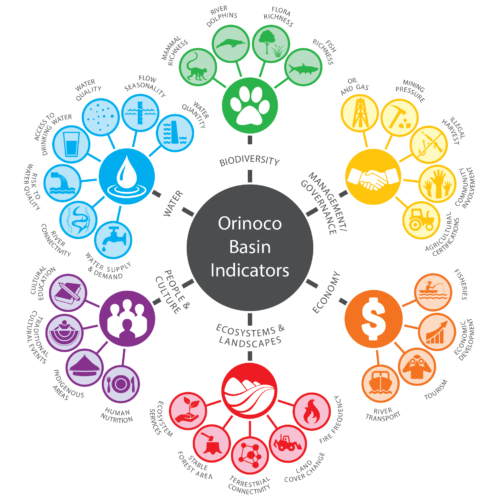
The Orinoco Basin report card included both ecological and social Indicators. Credit: Costanzo et. al. 2017. Practitioner's Guide to Developing River Basin Report Cards
But with so many variances and stakeholder input, how do we ensure that our report card is truly objective? The richness of a report card is the selection and integration of the available data and it is very important to maintain transparency in the objectives and data that support a report card. It is necessary to review the integrity of the data, decide what is included and honestly evaluate the quality of the information. This process should be clearly reflected in the white paper that accompanies the report card, in such a way that it can be guaranteed that all the results presented can be clearly explained. It is very important to keep in mind that if you include data that is not reliable, then the entire process is in doubt and therefore the credibility of the report card.
For next class, our first assignment is to make a PowerPoint presentation (about 10 slides) providing information about the ecosystem we are working on and explaining the dimensions of our site, the issues related to it, the interest in working in that area, etc. We are going to start with the first stage of phase I in the process, conceptualization. We're all very excited to learn more about each other's sites- stay tuned and you can learn more as well! So see you next week!
Reference:
Costanzo, S.D., Blancard, C., Davidson, S., Dennison, W.C., Escurra, J., Freeman, S., Fries, A., Kelsey, R.H., Krchnak, K., Sherman, J., Thieme, M. Vargas-Nguyen, V. 2017. Practitioner's Guide to Developing River Basin Report Cards.IAN Press. Cambridge MD USA.
Next Post > Mountains as Sentinels of Change: Summary from Belmont Forum
Comments
-
Namafe Namafe 5 years ago
Well written Blog and is truly representative of what was discussed. However, I have three main comments to add. The first one has to do with the actual list of students who attended the first session. I am not sure whether Meki Chirwa, Kabika Joel and Alice Nambeye were among the students who attended the first session. Secondly, I haven't quite captured information relating to the actual evolution of report cards in the blog beginning the journey with Moreton Bay in 1998, Chesapeake Bay in 2006, Mississippi River Basin in 2015, Orinoco River Basin in 2006 and ultimately trying to develop open source report cards. Lastly, I haven't captured any information relating to people's testimonies and experiences in the application of the report card. Examples of people who gave their impressions of the report card process include Mayors Allan Sutherland and Jim Soorley both from Australia and Governor Martin O'Malley from the US.
-
Ricardo Merlos 5 years ago
I'm very glad to be part of this course! I really enjoyed meeting people from different places.
Some words I want to highlight about the blog: "Building a report card is really a process, not just a result..." And that's right, report cards are just the beginning of a reliable monitoring programme for an ecosystem.
Some important ideas written: transparency, integrity of the data, citizen science.