Great Barrier Reef report card workshop
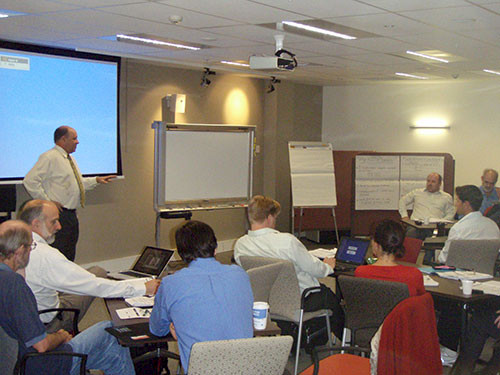
Bill Dennison ·On May 25-26, a workshop was convened in Brisbane, Australia to develop a strategy to create a 'paddock to reef' environmental report card for the Great Barrier Reef. The Queensland Department of Premier and Cabinet organized the workshop and IAN staff served as facilitators, Bill Dennison, Heath Kelsey and Jane Thomas. The workshop was held in downtown Brisbane, as the majority of data providers were based in Brisbane, with several people attending from MacKay and Townsville in northern Queensland. The impetus for the report card is a result of the significant investments that the state and federal governments are putting into reef protection activities (AUD$200,000,000 each). In order that the Queensland Premier, Anna Bligh, and the Australian Prime Minister, Kevin Rudd, are provided with feedback on their investments, the Reef Plan Baseline Reporting was instituted over the past couple of years. Grahame Byron and Chris Chinn from the Queensland Department of Premier and Cabinet were tasked with assembling the scientists from a variety of agencies and institutions to produce report cards for the management adoption and effectiveness (paddock scale), catchment condition and loads (catchment scale), marine water quality, inshore seagrass and coral indicators (reef scale). The shorthand for the Paddock to Reef program is P2R.

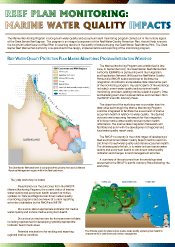
The two day workshop was broken down into various segments with increasing numbers of people involved, so that by the end of the second day, the report card mock up was presented to the assembled groups of data providers and representatives from state and federal government. On Day 1, chapter authors and regional coordinators met with IAN and QDPC staff. The chapter authors of the technical report presented an overview of their findings and approach for data integration. An initial report card layout was constructed and conceptual diagrams drafted for each of the six reporting regions and for the Great Barrier Reef overall. On Day 2, the CAG group joined the workshop and were presented with the outcomes of the Day 1 mockup and conceptual diagrams. Break-out sessions were organized for the rest of the morning to work on specific data sections and the report back resulted in a draft mock up of a six page report card (via a back and front printed trifold), two page (via a single page back and front) inserts for each reporting region as well as a methods overview. Following a plenary synthesis of these layouts, an additional group joined in, termed the IOC, Intergovernmental Operational Committee, with state and federal representatives. Following their briefing, they provided valuable immediate feedback.
Over the next few months, IAN staff will be working closely with various Australian scientists to produce this initial report card of the Great Barrier Reef and catchment. IAN was involved with an initial report card scoping exercise led by the Great Barrier Reef Marine Park Authority two and a half years ago, in which the marine indicators of the report card were developed: water quality, seagrasses and corals. This initial scoping has helped set the stage for the current effort, including dividing the Great Barrier Reef into 6 reporting regions (north to south): Cape York, Wet Tropics, Burdekin, Mackay/Whitsunday, Fitzroy, Burnett/Mary.
About the author
Bill Dennison

Dr. Bill Dennison is a Professor of Marine Science and Interim President at the University of Maryland Center for Environmental Science (UMCES).
Next Post > IAN in American Samoa
Comments
-
Atika 6 months ago
Thank you for sharing this great information with us, i really appreciate your post!
