Brisbane 2011: Living with Floods and Dancing with Dugongs: Part 6- Global Initiatives in Response to Flooding
Bill Dennison ·Let's take a trip around the world and look at five examples. I'm going to do two examples from North America that I have been working with; the Chesapeake Bay on the east coast, and coastal Louisiana--the mouth of the Mississippi River with marshes and the city of New Orleans. Let's look at the two major floods and how people have responded to those floods. They happened in 2003 for the Chesapeake and 2005 for Louisiana. In the Chesapeake there was a large hurricane called Isabel. It was a category 5 when it was in the Caribbean, but lost a lot of energy when it came across land. It made landfall at Cape Hatteras and went up to the west of the bay. There was lots of flooding in downtown Washington, downtown Baltimore and downtown Annapolis, as well as flooding in agricultural and other rural areas. Once again, we could have predicted this flood. This had a very similar track and magnitude of a hurricane that happened in 1933, before they named the hurricanes. They called it the 'Storm King'. It was a massive storm, like Isabel, with the same barometric pressure, same wind speeds, and same flood height. So, we could have predicted this, but we didn't, and we lost thousands of cars in my county alone. With any preparation we could have driven the cars up to a higher ground.

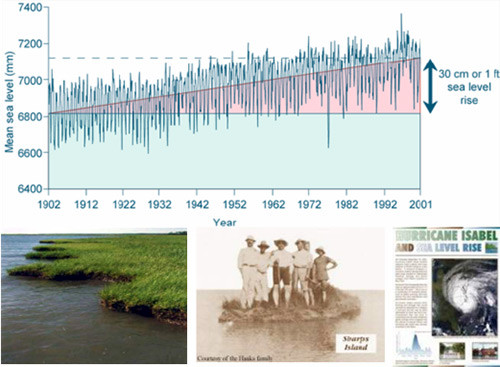
The storm surge record, based on the tide gauge, where we can see the graphs from the storms in 1933 and 2003 are almost identical. You have a tide surge down at the mouth, and then up the bay, a later and larger surge. Now, this is where the learning moment came about. This gave us an opportunity to start talking about climate change and sea-level rise. This was during a period when our federal government and our state government were climate deniers and didn't want to talk about it. We weren't even allowed to use the word 'climate change'. You see our newsletter was Hurricane Isabel and Sea-Level Rise. No 'climate change' in that. We kept it out of that. We tracked, through the tide gauge in Baltimore, that the tide height was thirty centimeters higher over a hundred-year period.

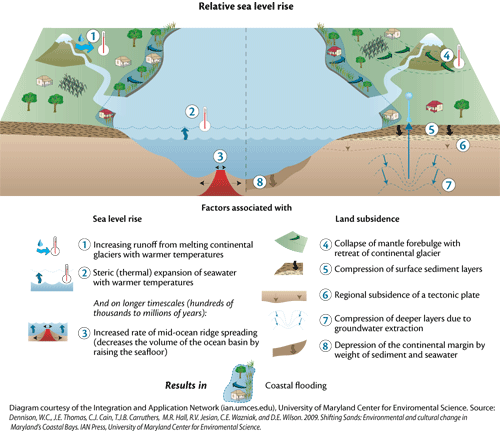
There was even a guy who, with a pencil, marked on his kitchen wall, the height of the 1933 storm surge. He didn't wash or paint the wall. In 2003, he marked it again and there was a considerable difference. I showed you already that it was the exact same storm. What was different was sea-level rise. Sea-level rise is something that people in Chesapeake are accustomed to. We're losing lots of marsh, about a half meter, linearly, per year. We've had thirteen occupied islands with farms, with schools, with houses, with banks and stores that are now gone. They are underwater. Sharps Island in the 1930's is now just a shoal and a lighthouse. So, people have been migrating off these islands for some time now.

So that allowed us to really get into this sea-level story, and then take it to climate adaptation. Here we weren't arguing about the causes of climate change, and we weren't talking about IPCC kinds of issues, we were just saying "Look, we're going to have to deal with sea-level rise in these low lying areas, and we are going to have to prepare ourselves." So that allowed us to get involved in a discussion that needed to happen in society. We also took the opportunity to put public signage in prominent places. So you go to downtown Washington and Alexandria area, or downtown Baltimore, or on the piers. We have photographs and we have messages that talk about the flood. Don't forget. That's why those brass plaques down the street are good reminders. More places to remind people that this is a flood prone area. Then we were able to take from this initial sea-level rise, we were able to add much more agricultural adaptation strategies; talk about impact assessments which will result in the mitigation strategy for CO2 emissions. That was also because we had state and federal governments willing to talk about climate change, and things were able to move more quickly. But the point was that we were even able to start that discussion using the 2003 event. We also had a conference a year after the event, and we wrote a book, and that is something that makes sense for Southeast Queensland as well.
This blog post was created from a presentation by Bill Dennison, delivered at the historic Customs House in Brisbane, Australia on 8 July, 2011 (full powerpoint presentation can be accessed on IAN Press.
About the author
Bill Dennison

Dr. Bill Dennison is a Professor of Marine Science and Interim President at the University of Maryland Center for Environmental Science (UMCES).
Next Post > Brisbane 2011: Living with Floods and Dancing with Dugongs: Part 5- Preparing for Floods
Comments
-
Atika 7 months ago
Thank you for sharing this great information with us, i really appreciate your post!