Innovations in Environmental Synthesis, Reporting and Governance: Part 5 - Innovations in Science Communication
Bill Dennison ·I distinguish science communication from science writing. If you think about a science paper, you provide lots of references, which is the scientific context for that study. Science communication provides societal examples, because it's all about context, to make the message translate to a broader audience. In scientific literature, there is usually just text, while in science communication, we try to balance with graphics and use color. We worry in scientific publications about who's the first author, who's not an author, and the types of acknowledgement. Scientific communication is much more inclusive, and we generally have a larger list of authors. In science writing we focus on the results, and how we can interpret those results, while in science communication we focus on the conclusions and recommendations, and how we can turn those results into policy or implementation.

And after doing this for ten years or so, I feel that you can teach science to anybody, as long as you provide synthesis, visualizations and context. You can have cab drivers explaining to you what denitrification does if they are given enough synthesis, visualization and context. One of the tools we have been evolving, what I would call an innovation, is using conceptual diagrams to communicate science effectively. What I mean by 'conceptual diagram' is a diagram using symbols that depicts the essential attributes of a system, or a 'thought drawing'. We’ve found that these are useful because they help clarify our thinking; they allow and invite two-way communications with the community. When I was involved in the Healthy Waterways program in the Southeast Queensland, going out to the church basements and council chambers on a regular basis, I would show people pie charts and other scientific output graphs. Their eyes would glaze over, and hopefully they trusted me, but it didn’t invite any dialog. When I put up a colorful diagram, they were all over it. It created a two-way dialog. Conceptual diagrams are also good for identifying gaps and priorities. We use diagrams in proposals, and for developing synthesis, and we’ve actually published scientific papers using a diagram as a central organizing theme or a figure to add to the message. The technique of using symbols in conceptual diagrams is ancient, and it’s extremely powerful. Symbols were around long before words, and they are cultural and language independent. We put a symbol library on the web about six years ago, and people really started grabbing on to it and it started creating, slowly but surely, a global symbol language. We have 2500+ symbols currently in our library that have been downloaded from virtually every corner of the world. Originally they were created for use with Adobe Illustrator, a fairly expensive software program, but we’ve recently been able to create an online version that does not require software.

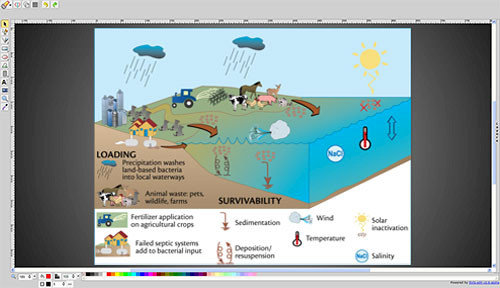
On our IAN website we have created an online conceptual diagram creator where you can access these 2500 symbols one by one. It’s not as powerful as Illustrator, but it’s free. This kind of tool, with the language created by using symbols, can allow us to communicate more broadly, across more cultures and more places. After registering, you can go through a searchable library. You call up a base, and then populate a base with a symbol or a suite of symbols. The symbols are all vectors, they’re scalable, you can blow them up and they maintain their proportions, to use in posters, or alternatively as small thumbnails.
This blog post was created from a presentation by Bill Dennison to the Terrestrial Ecosystem Research Network in Melbourne, Australia on 29 Mar, 2011 (full powerpoint presentation can be accessed on IAN Press.
About the author
Bill Dennison

Dr. Bill Dennison is a Professor of Marine Science and Vice President for Science Application at the University of Maryland Center for Environmental Science.

