
2013 Chesapeake Bay report released
Bill Dennison ·
23 May 2014
| Environmental Report Cards | Science Communication |
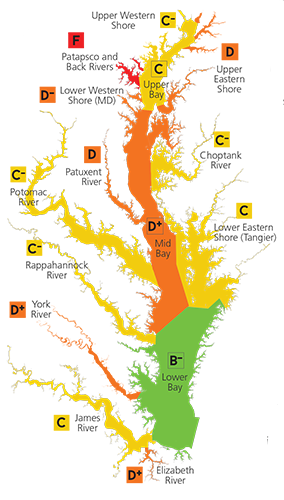
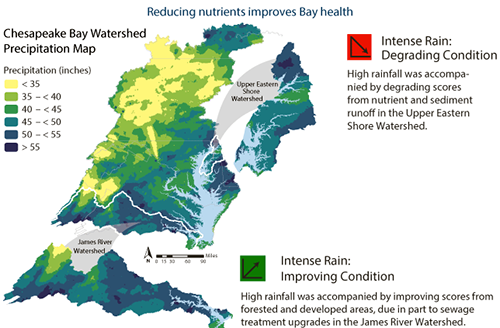
The 2013 Chesapeake Bay report card provides an important insight into how stormwater runoff affects the Bay. The contrast between the Upper Eastern Shore report card scores which are degrading over time versus the James River report card scores which are improving over time provides important insights. Both regions experienced intense rainfall in 2013, yet the report card scores responded differently.

In the case of the Upper Eastern shore, which is an agriculturally dominated watershed, this precipitation contributed to a decline in the report card scores, likely a result of runoff of fertilizer and animal manure applied to the agricultural fields. In the case of the James River, which is a forested and residential dominated watershed, this precipitation did not lead to a decline in report card scores, rather the report card scores actually improved. Our summary of this contrast in response to rainfall is the following: 'It is not the rain, but what the rain carries'.
We shot a few videos afloat on the Choptank River to summarize the 2013 report card (me), the development of a climate resilience index (Caroline Wicks) and fisheries indicators (Alex Fries). Ali Schwaab did a great job of shooting and editing the videos, including adding various visual elements into the videos.
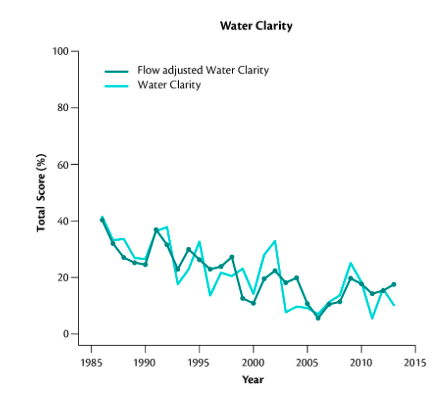
The flow adjusted results were particularly interesting in the 2013 report card. For example, the decline in water clarity noted in 2013 was actually much less than would be expected given the river flow into the Bay. Thus, using the flow adjusted results for water clarity, we can see improvements since 2006. Since the long term degradation in water clarity (1986-2006) was something that we have been very concerned about, the observation that this trend may have been reversed is heartening.
This year's report card patterns and trends are a microcosm of the various trends that were highlighted in the report recently released: New Insights: Science-based evidence of water quality improvements, challenges, and opportunities in the Chesapeake. The progress in sewage upgrades and air deposition contribute to the improvements in the Western Shore tributaries, while the challenges of stormwater runoff, particularly from agricultural lands on the Eastern Shore, contribute to the degradation of these tributaries.

We are also introducing a new component to the Chesapeake Bay report card - a climate change resilience index. Climate change is an important facet to the management of Chesapeake Bay, as increasing temperatures, rising sea levels, increasing acidification, and changes in precipitation amount and timing, for example, will affect our ability to restore Chesapeake Bay. We are developing indicators associated with various water quality parameters (e.g., turbidity), key species (e.g., warm water vs. cold water fish) and critical habitats (e.g., marshes and aquatic grasses) so that we can form a climate resilience index in future report card releases.

About the author
Bill Dennison

Dr. Bill Dennison is a Professor of Marine Science and Vice President for Science Application at the University of Maryland Center for Environmental Science.