A report card to tell your mom about: Environmental report cards provide transparent assessments of our aquatic ecosystems
Melanie Jackson, Chih-Hsien (Michelle) Lin, Detbra Rosales ·Melanie Jackson, Chih-Hsien (Michelle) Lin, Detbra Rosales
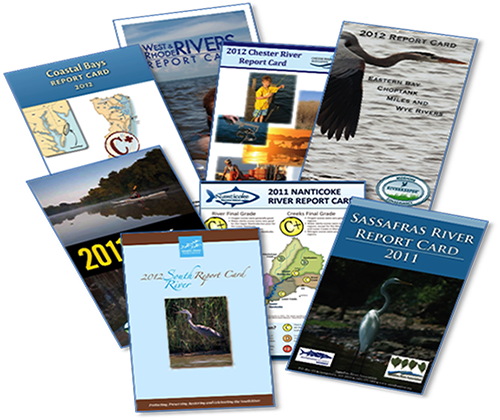
Students in grammar school and all the way to college have anxiety about receiving report cards, and often times devise plans for the best time to tell their parents about their not so stellar grades. Explaining poor grades to parents can involve tactics such as blaming the teacher for “just not liking you”; in contrast, this sort of bias is not involved in any step of creating the environmental report cards. Environmental report cards synthesize scientific findings in aquatic ecosystems with the use of indicators in order for the user to better understand science. The environmental report card is not a document to stuff and hide away in your backpack. It can be shared and discussed to enable readers to improve water quality by going after new research or education opportunities, along with solving environmental issues.
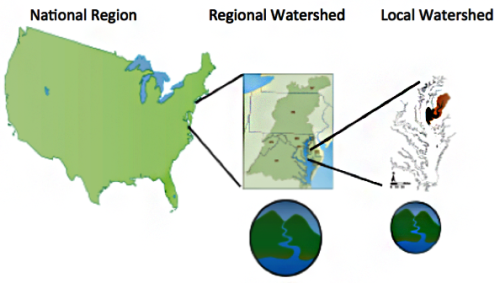
Environmental report cards provide a transparent snapshot of the health of systems ranging in size from the Chester River to the entire Mississippi River Watershed. Considering the great range of potential locations, watershed areas, and population sizes depicted in report cards, choosing the right indicators to accurately assess aquatic systems is important. Indicators are a sign or signal that relays a complex message about ecosystem health. Indicators must be sensitive to change, easy to collect, and reflect the issues we are trying to measure and gauge. Often times, this can depend on what data is available. Long-term spatial data is not always the cheapest to collect and so it is important to pick a robust indicator from the start.

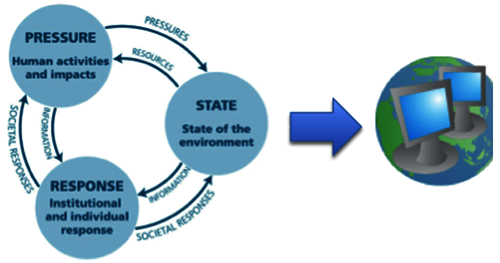
Not only can environmental report cards gauge the current health of systems, but they also have the ability to differentiate between naturally occurring stresses and those caused by humans (anthropogenic stresses). The environmental pressures in systems may change with time. As we fix one problem in the environment, report cards may “graduate” or “evolve” and people in the community may learn something new about the data that they have.
Environmental report cards themselves provide information, but they also facilitate interaction among people who have different perspectives and can bring awareness and increase political knowledge. In our global world, report cards can incorporate socio-economics, such as employment, income and production with ecosystem indicators. In addition, it will be interesting for the future of report cards if we could incorporate citizen science, considering obtaining data can be a limiting factor in picking indicators. It is an appealing idea to have the public more involved with the report card making process, by providing data; however, the tools required for a large number of citizen researchers is limited along with cost sharing capabilities. Overall, the report cards reflect that we can get a large amount of information and synthesize it into a score. At this exciting point in time, with the expanding use of the internet and global communication, the environmental report card is a tool that can inspire larger audiences based on science.

During our Science for Environmental Management class discussion we projected what the future for report cards may look like based on some of the topics that came up, and here were some of the interesting take aways:
- Global report cards with an online repository showing statistics and graphs for trajectories around the world. This would involve a standard website template with all of the report cards in one place.
- Train more of the public in the report card making process so that more groups can make their own scientifically robust report cards
- Try new ways of “packaging” report cards so that public has more interest. For example: Discussing the health of systems as a historical story.

References:
- Longstaff BJ, Carruthers TJB, Dennison WC, Lookingbill TR, Hawkey JM, Thomas JE, Wicks EC, Woerner JL (2010) Integrating and Applying Science: A practical handbook for effective coastal ecosystem assessment. IAN Press, Cambridge,MD. Chapter5: Ecological indicators.
- Longstaff BJ, Carruthers TJB, Dennison WC, Lookingbill TR, Hawkey JM, Thomas JE, Wicks EC, Woerner JL (2010) Integrating and Applying Science: A practical handbook for effective coastal ecosystem assessment. IAN Press, Cambridge, MD.Chapter 6: Ecological report cards.
Next Post > Willamette River Report Card – I can see the light at the end of the tunnel
Comments
-
Sabrina Klick 10 years ago
I thought the blog did a good job on talking about environmental report cards in a way that the public can understand as well as highlighting future needs with a centralized depository. The graphics and images are really good at re-enforcing relevance and usefulness of using environmental report cards for management decisions. It is also important to note that the report cards have to be tailored and customized to environment of interest. I agree that report cards are a good way to get citizens involved in the process.
-
Stephanie Siemek 10 years ago
I agree with this blog. Back in middle school we were either afraid or excited to share our report card results with our parents. But environmental report cards should be shared either way. It is a good assessment of how the human population is doing in terms of taking care of its watershed. However, it is important to understand this is not a final grade, but rather a progress report. When a low grade is received it means improvement is needed, but we can strive to do better. I think having these report cards is a great, creative way to break down the environmental issues so everyone can relate and understand. Let’s keep striving for that A!
-
Emily Russ 10 years ago
I really enjoyed how the authors juxtaposed the grammar school report cards with the environmental report cards. I believe that these report cards are an excellent way to effectively communicate science to a non-scientific audience, which fits well with the theme of the semester, and I especially like the idea of translating the information into a story to make it more interesting to the public. I think this provides context, and even allows people to make a personal connection with the area and its environmental issues.

