Using report cards to get the synoptic big picture: An astronaut's view
Bill Dennison ·This blog is part of the Basin Report Card Initiative: a partnership between theWorld Wildlife Fund (WWF) and the University of Maryland Center for Environmental Science (UMCES)
One of the attributes of report cards that is particularly useful is the ability to view a whole system synoptically. We often refer to this synoptic view as analogous to flying over at a high altitude. So this provoked me to investigate just how high an altitude we were looking at when developing report cards for different regions. To help me answer this question, I turned to Andrew Elmore, a colleague at the Appalachian Laboratory who is a remote sensing and Geographic Information System expert. Andrew quickly grasped the concept of this metaphor and shared an equation for calculating altitudes. He also suggested appropriate assumptions necessary to make the calculations.
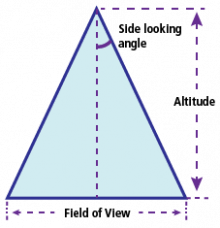
Andrew explained that to calculate the altitude above a region, you need to measure the field of view on the ground. In terms of a report card region, this can be taken as the longest distance from one edge of a reporting region to the opposite edge. In a somewhat circular region like the Mississippi River basin, this measurement can be taken from a variety of angles netting the same result, akin to measuring the diameter of a circle. For a linear or elongated reporting region like the Maryland Coastal Bays, the longest axis of the reporting region (north-south) needs to be measured. I used the distance measures on google earth to calculate these field of view distances of various report card regions.
Another component to the calculation of altitude is the 'side looking angle'. This refers to the width of view from directly overhead that is being viewed. Andrew suggested that we use the side looking angle of the Landsat satellite sensor which is 7.5 degrees. In the calculation, the tangent of this 7.5 degree angle is used, which took me back to high school trigonometry. It was fun to dust off these mathematical concepts which have been dormant in my brain for several decades.
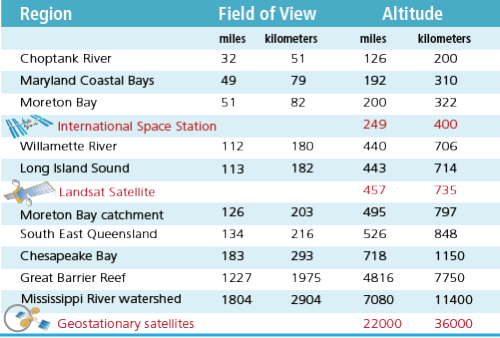
Using this equation and assumptions, I calculated the altitude of ten regions where the
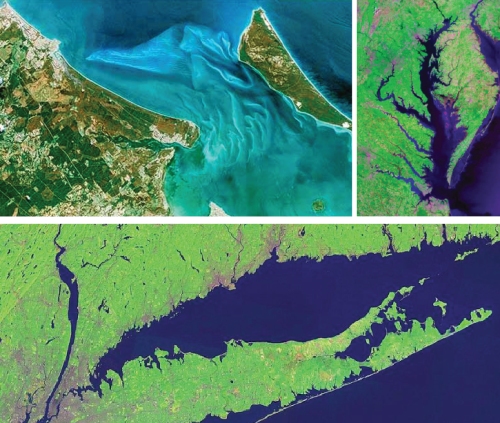
The range of altitudes for viewing the smallest reporting region (Choptank River) to the largest region (Mississippi River basin) was 126 miles (200 km) for the Choptank River to 7080 miles (11400 km) for the Mississippi River basin. This represents a range that is over fifty fold, which led me to imagine riding a rocket ship up into space to be able to view these different scales in a reasonable amount of time. The first report card I was involved in developing was for Moreton Bay, Australia. The equivalent altitude of this reporting region was 200 miles (322 km). After several years, we expanded this reporting region to encompass the entire catchment (or watershed) which meant that we had to metaphorically fly to a higher altitude (495 miles; 797 km). We expanded the region again to include the Sunshine and Gold Coasts of Southeast Queensland, again gaining altitude (526 miles; 848 km). Years later, we had the opportunity to develop a Great Barrier Reef report card just to the north of Moreton Bay, in which we had to fly ten times higher (4820 miles; 7750 km). These different altitudes for report card regions are the equivalent of zooming in and out on Google Earth. In order to appreciate what these different altitudes corresponded to in terms of viewing distances, I looked up the altitudes of various viewing platforms. The altitude used for obtaining aerial photographs for the annual assessment of submerged aquatic vegetation that Bob Orth and his Virginia Institute of Marine Science colleagues employ is 12,000 feet (3.66 km). While this altitude is appropriate for estimating one of the Chesapeake Bay indicators, it is much too low to be able to view the system as a whole. Another altitude is the 'bird's eye' view, so I learned that bald eagles have been observed to fly to 15,000 feet (4.57 km), still too low to gain a whole system view. The next altitude I chose was that of a commercial aircraft, with a typical cruising altitude of 36,000 feet (11.0 km), still far short of the synoptic aerial view for a report card reporting region. The altitude of the International Space Station is 250 miles (400 km), which is close to the altitudes of several report card regions, in particular, Moreton Bay, Australia. The altitude of the Landsat satellite is 438 miles (735 km), and for the past thirty years, we have become accustomed to viewing images of the earth from this distance. This altitude corresponds closely to the altitude of several reporting regions, including Long Island Sound, Willamette River and Moreton Bay's catchment. For larger report card regions, it is necessary to stitch together mosaics of several Landsat images in order to cover the entire region. For the largest report card area, the Mississippi River watershed, the necessary altitude to view the entire watershed synoptically (7080 miles; 11,400 km) is 16 times higher than the Landsat satellite, in fact it is 3% of the distance to the moon. The geostationary satellites orbit the earth in synchrony with the earth's rotation at a very high altitude (22,000 miles; 36,000 km), which are used for meteorology and communications. So this exercise illustrates one of the great attributes of report cards. They really do provide a high altitude synoptic view of regions; views that are normally only available to astronauts. One of the comments that I recall from astronaut Ricky Arnold's recent visit to the Marine Estuarine and Environmental Science Colloquium was that he didn't see political borders from space. Report cards focus on natural boundaries of embayments, rivers or watersheds, not on political boundaries. Ricky also shared some of the astronaut's views of the earth which were mesmerizing, as illustrated by the popularity of arresting images and videos from the International Space Station available on the Internet. Report cards can provide a layer of integration to these astronaut views of earth. They allow one to quickly grasp the 'big picture' and just as astronauts return to earth transformed by their experience, report cards can be transformative to those who view them.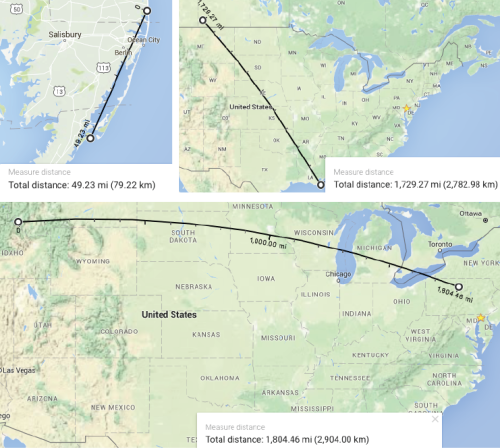
About the author
Bill Dennison

Dr. Bill Dennison is a Professor of Marine Science and Vice President for Science Application at the University of Maryland Center for Environmental Science.

