Science visualization courses teach students to "Let it go"
Bill Dennison ·The Science Visualization course in the Fall 2016 semester that wrapped up in December 2016. The first time this course was taught was in Spring 2016, when it was offered for graduate credit with the Marine Environmental and Estuarine Science (MEES) program. In this second round of teaching, it was targeted for people in environmental government agencies and non-government organizations. In the non-MEES course, we had students from several states participate (Maryland, Delaware, North Carolina, Massachusetts, Colorado). In both cases, the course materials (lecture videos, blogs and student communication products) have been uploaded to the sciencevisualizationclass.wordpress.com, which Vanessa Vargas set up. Vanessa was the teaching assistant for the MEES class and Dylan Taillie was the teaching assistant for the follow-up class. A large proportion of IAN staff participated in teaching the course, providing videos and reviewing student projects.
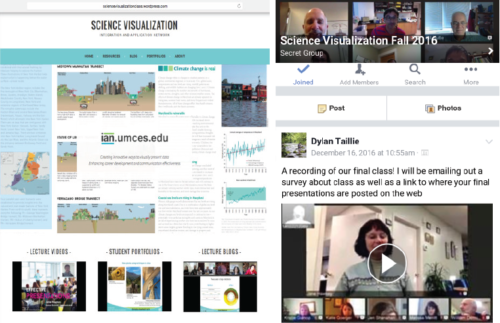
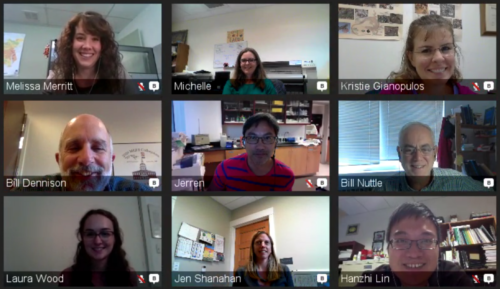
Several novel teaching strategies were employed in these classes. A "flipped" or "inverted" classroom was used, with lecture materials and tutorials provided via YouTube videos prior to class time. Class time was devoted to discussion of approaches and techniques and allowed time for extensive, detailed review of student projects. Students took turns summarizing the discussions and creating some incredibly insightful blogs, posted weekly on the IAN web site. Classes were conducted using GoToMeeting or Bluejeans software. We found Bluejeans accommodated more simultaneous live streaming video feeds than GoToMeeting, so this became our preferred option. We used Moodle in the MEES version of the course for posting readings, making announcements and uploading project materials. In the non-MEES version of the course, we experimented with a private Facebook group to upload course materials and share and comment on materials. Both approaches were useful, and I anticipate to be using Moodle in MEES courses and private Facebook group for non-MEES courses in the future.
We learned several things from teaching these courses. First, there is a need and desire for bet-ter science communication within and beyond academia. Second, the incredible diversity of students from a variety of disciplines, working in a variety of institutions, agencies and organizations was enriching to other students as well as the teaching staff. Third, the central theme of combining strong narrative structure with effective visualizations was key to all science communication products (e.g., peer review publications, fact sheets, posters, web materials). Fourth, it did not seem to matter whether or not each student provided materials on time for each module to benefit from class discussion and critical review of other students' materials. And finally, we learned that we really do enjoy sharing our knowledge and seeing the different ways that students can generate science communication products. The last class session was bittersweet each time.
The dramatic increase in student competence for being able to produce clear, understandable and attractive science communication products was staggering. In previous short, immerse courses conducted in person, students are provided the philosophy and approach for effective science communication, but lack the hands on training and skill development that a semester long course can provide. In the future, we will continue to teach short, immersive courses, but focus these courses in developing better narrative and visual intuition, and the semester long course for developing hands on skills.
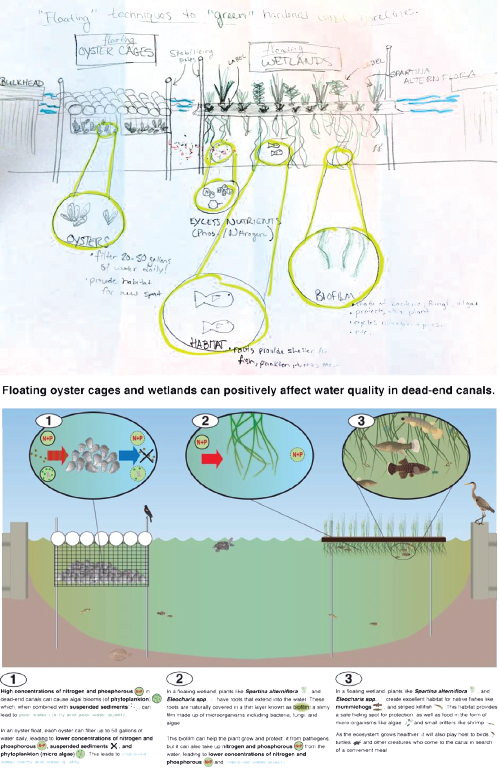
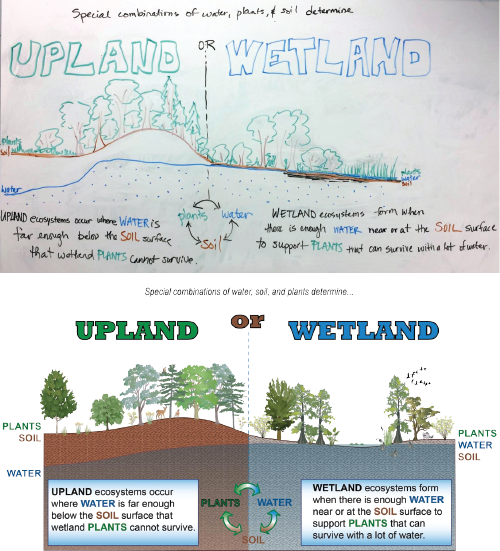
At the end of each semester, students presented their final products and discussed what they learned in the courses. A central theme emerged from these wrap up summaries. This theme was to let go of the "chart junk", convoluted reasoning and the tendency to try to tell too much all at once. Several students used the term "Let it go" in dispensing with extraneous materials and distilling the message. This prompted me to adapt the song "Let it Go" from the movie "Frozen" with the following lyrics (which I am sad to report was performed to the class):
"Let It Go"
14 December 2016
The data glows bright on the graph tonight
Not any chart junk to be seen
A kingdom of simplicity
And it looks quite keen.
The data are howling like this swirling storm inside
Couldn't keep it in, heaven knows I tried!
Don't let the junk in, don't let them see
Be the good communicator you always have to be
Simplify, don't confuse, so you let them know
Well, now they know!
Let it go, let it go
Can't junk it up anymore
Let it go, let it go
Turn away and slam the door!
I don't care
What they're going to say
Let the data rage on,
The simplicity never bothered me anyway!
About the author
Bill Dennison

Dr. Bill Dennison is a Professor of Marine Science and Vice President for Science Application at the University of Maryland Center for Environmental Science.

