CMC Data Interpretation Course in Richmond, VA and Carlisle, PA
Yesenia Valverde · | Science Communication |
Throughout the Chesapeake Bay watershed, volunteer monitoring groups collect and assess important water quality and benthic macroinvertebrate data. Thanks to the hard work of the Chesapeake Monitoring Cooperative, many valuable resources, including methods manuals and factsheets, provide groups guidance in ensuring the quality-and therefore value-of their data. Working to integrate this non-traditional monitoring data into the larger effort of the Chesapeake Bay Program partnership, the CMC provides logistical and outreach support by way of recruitment, resource development, trainings, and much more.
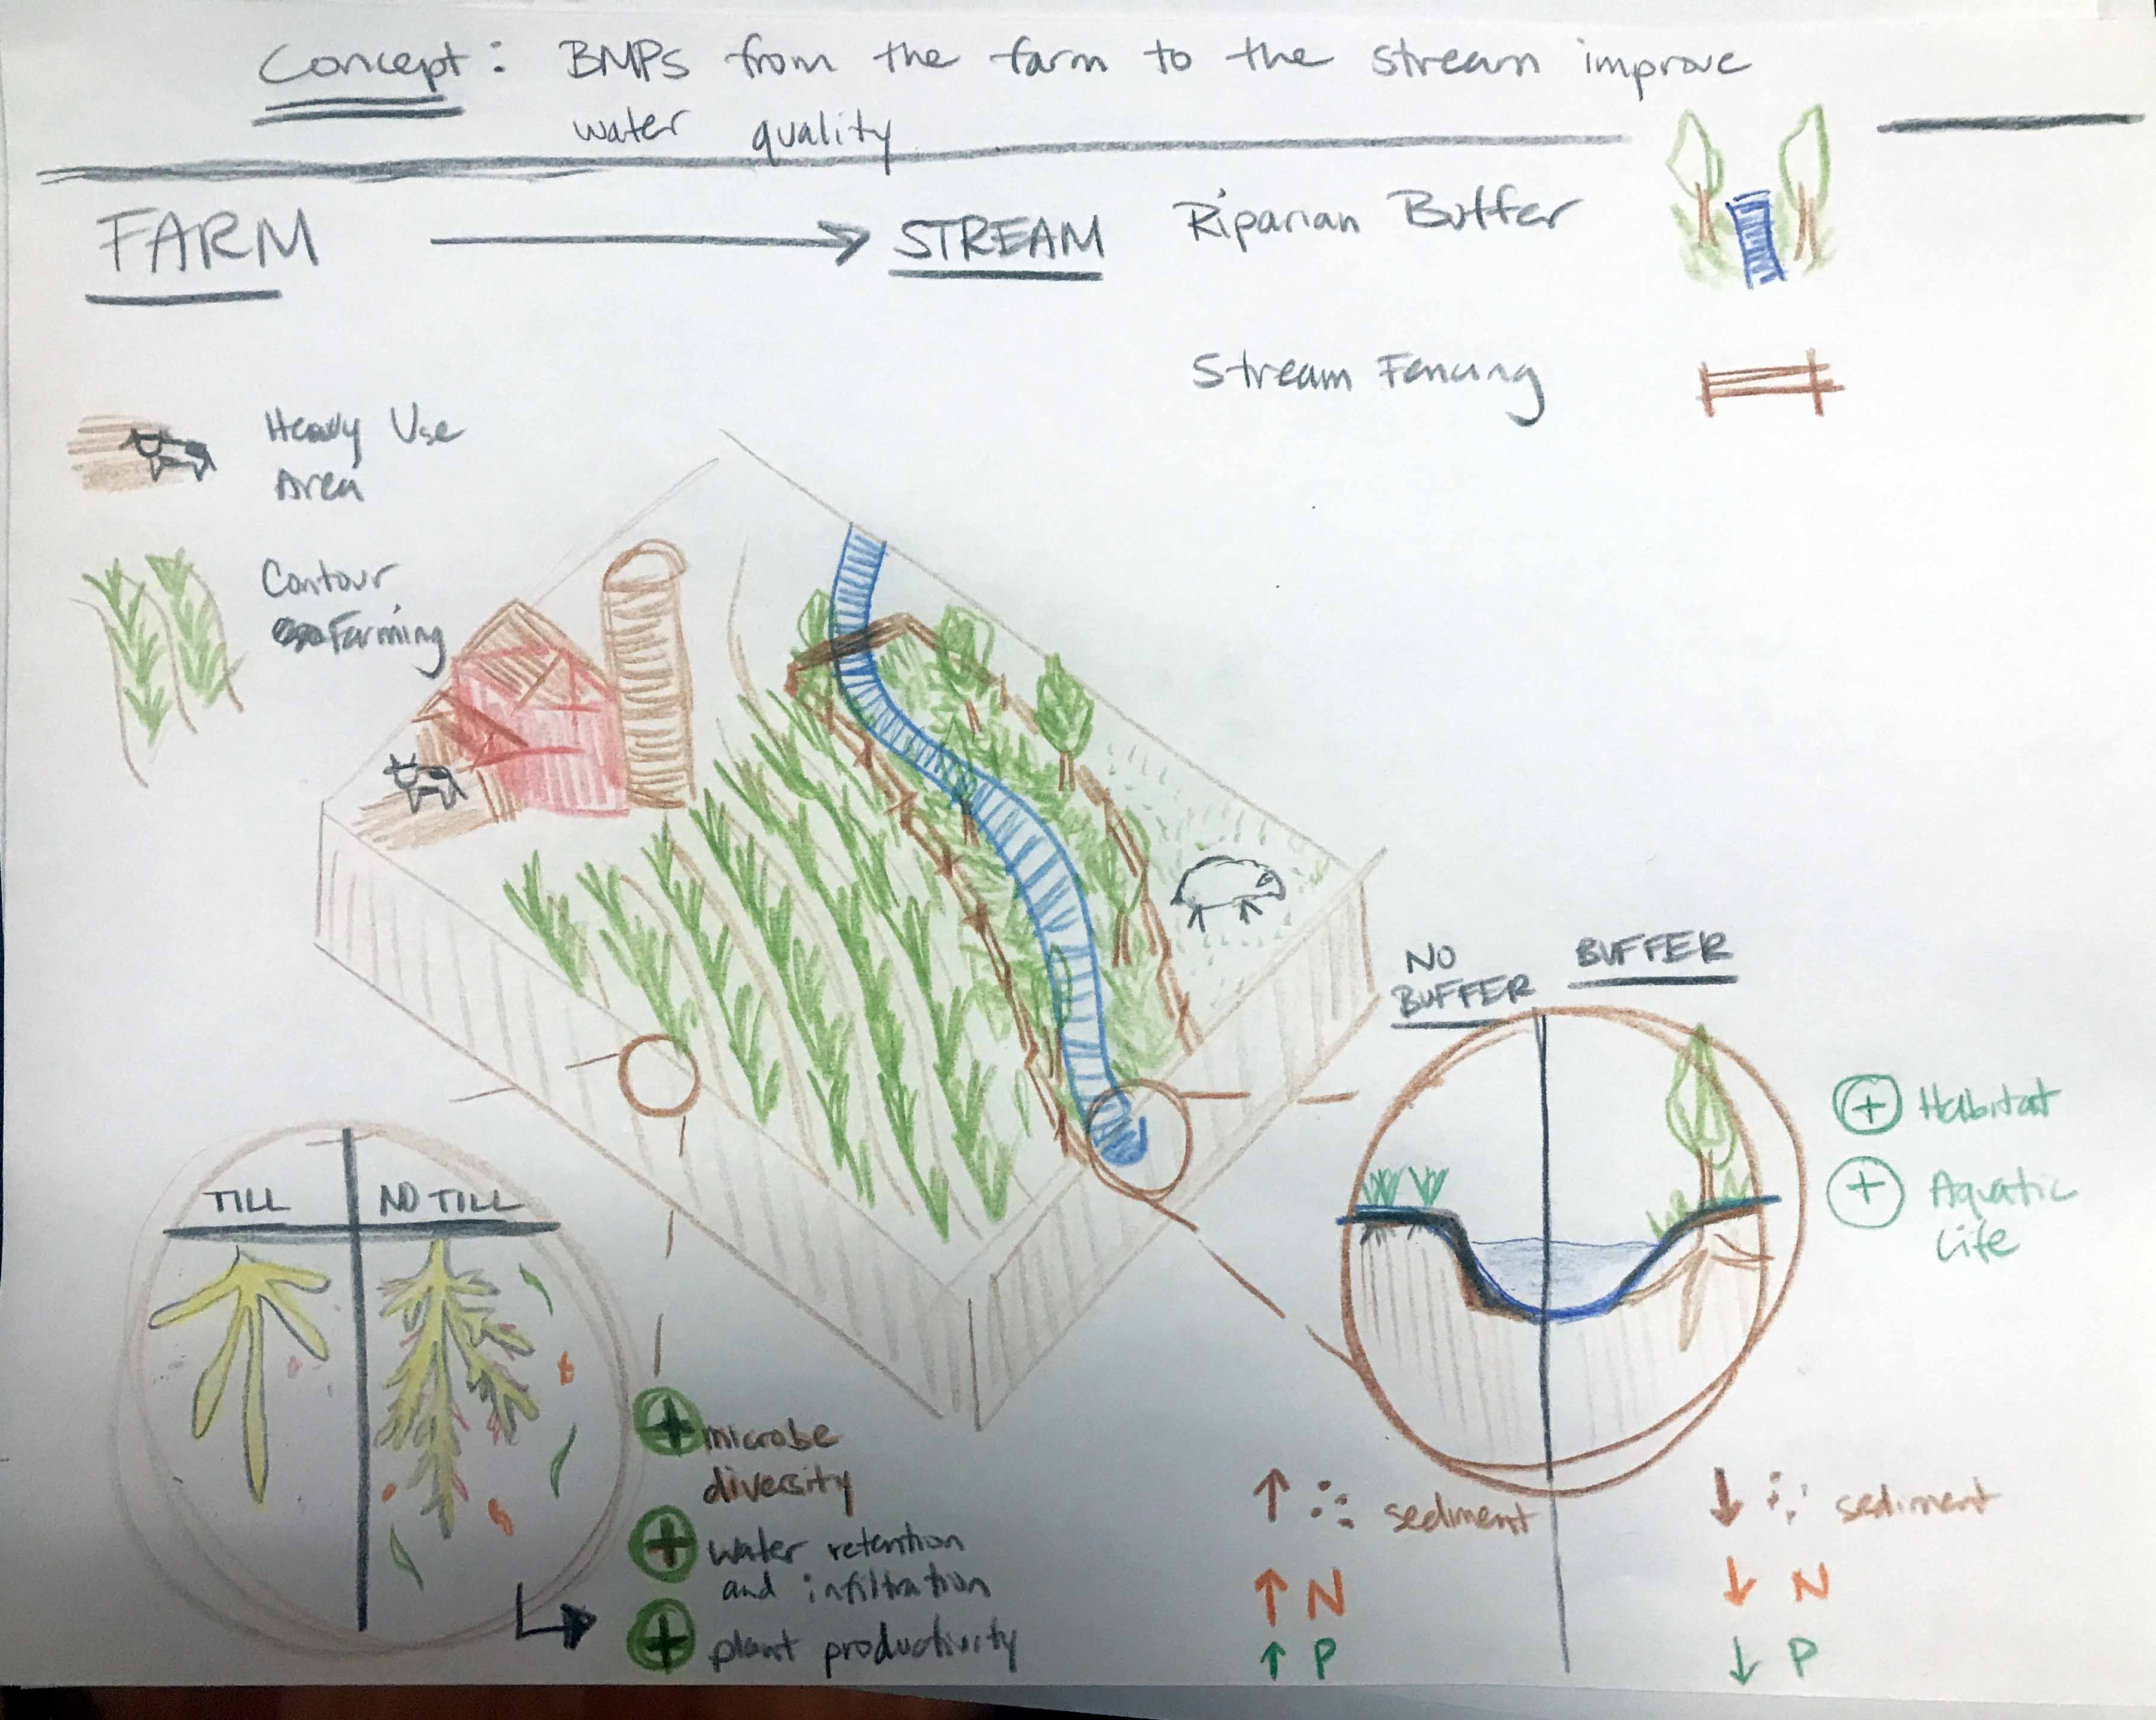
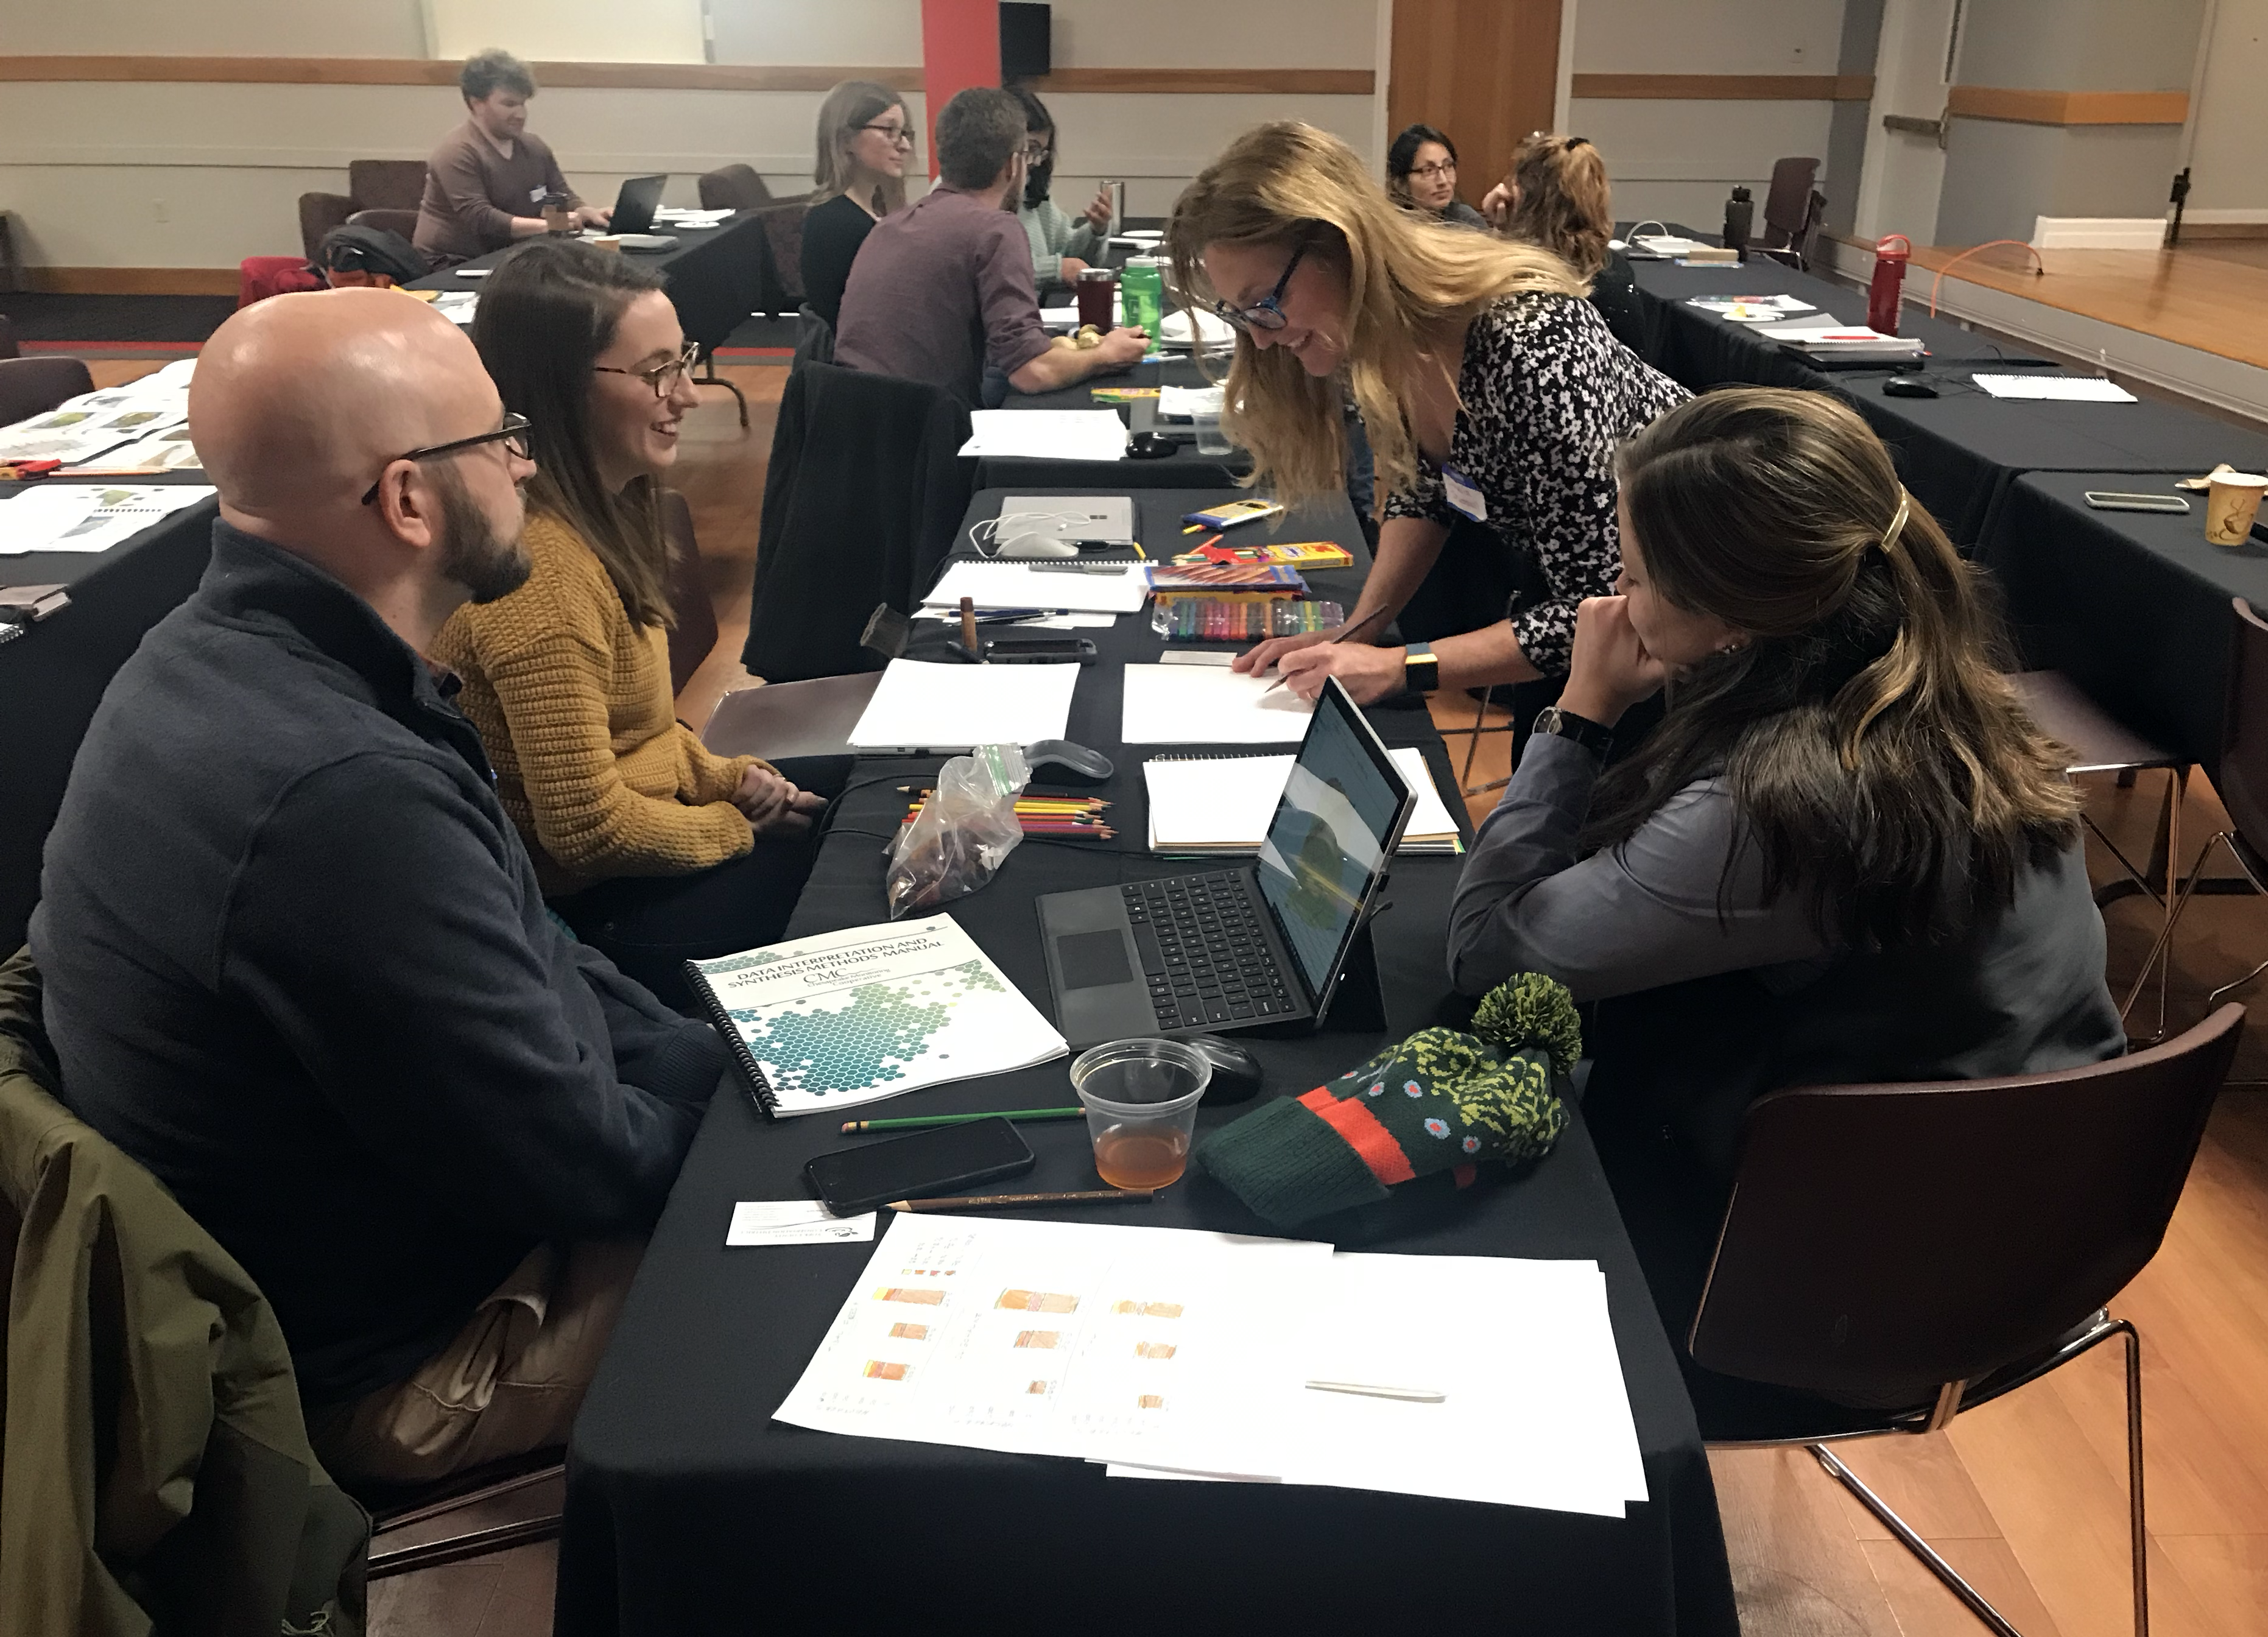
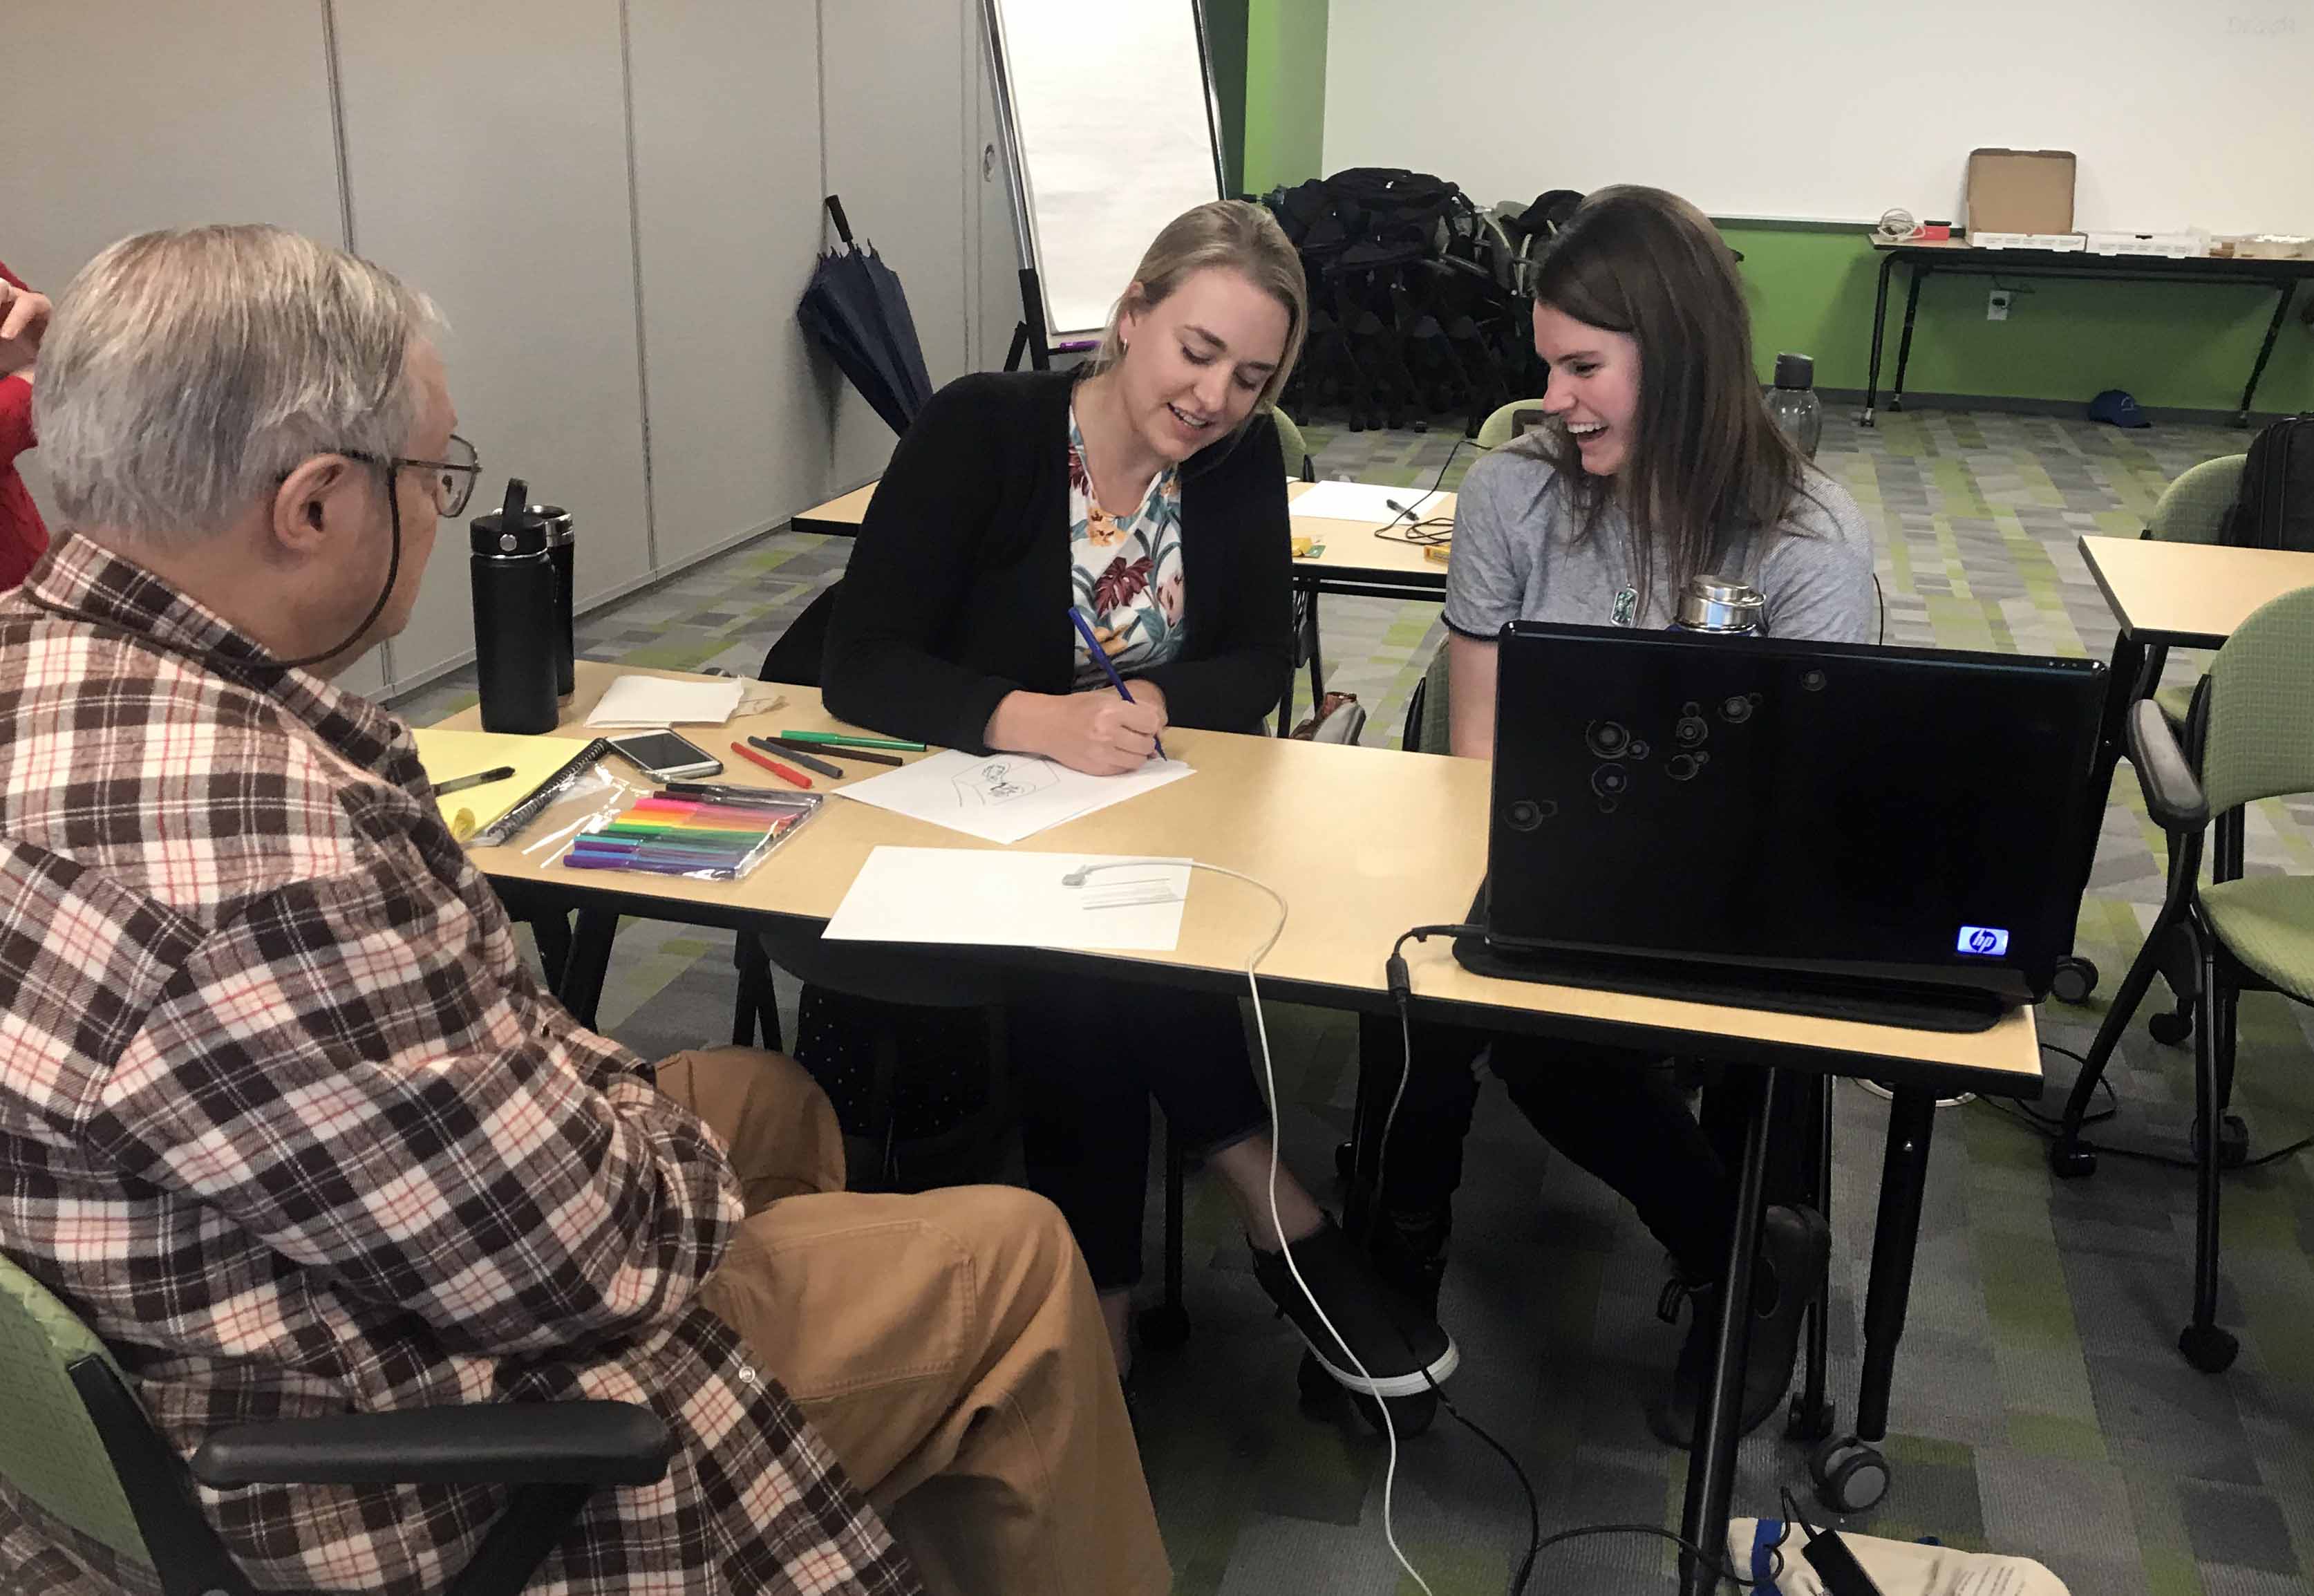
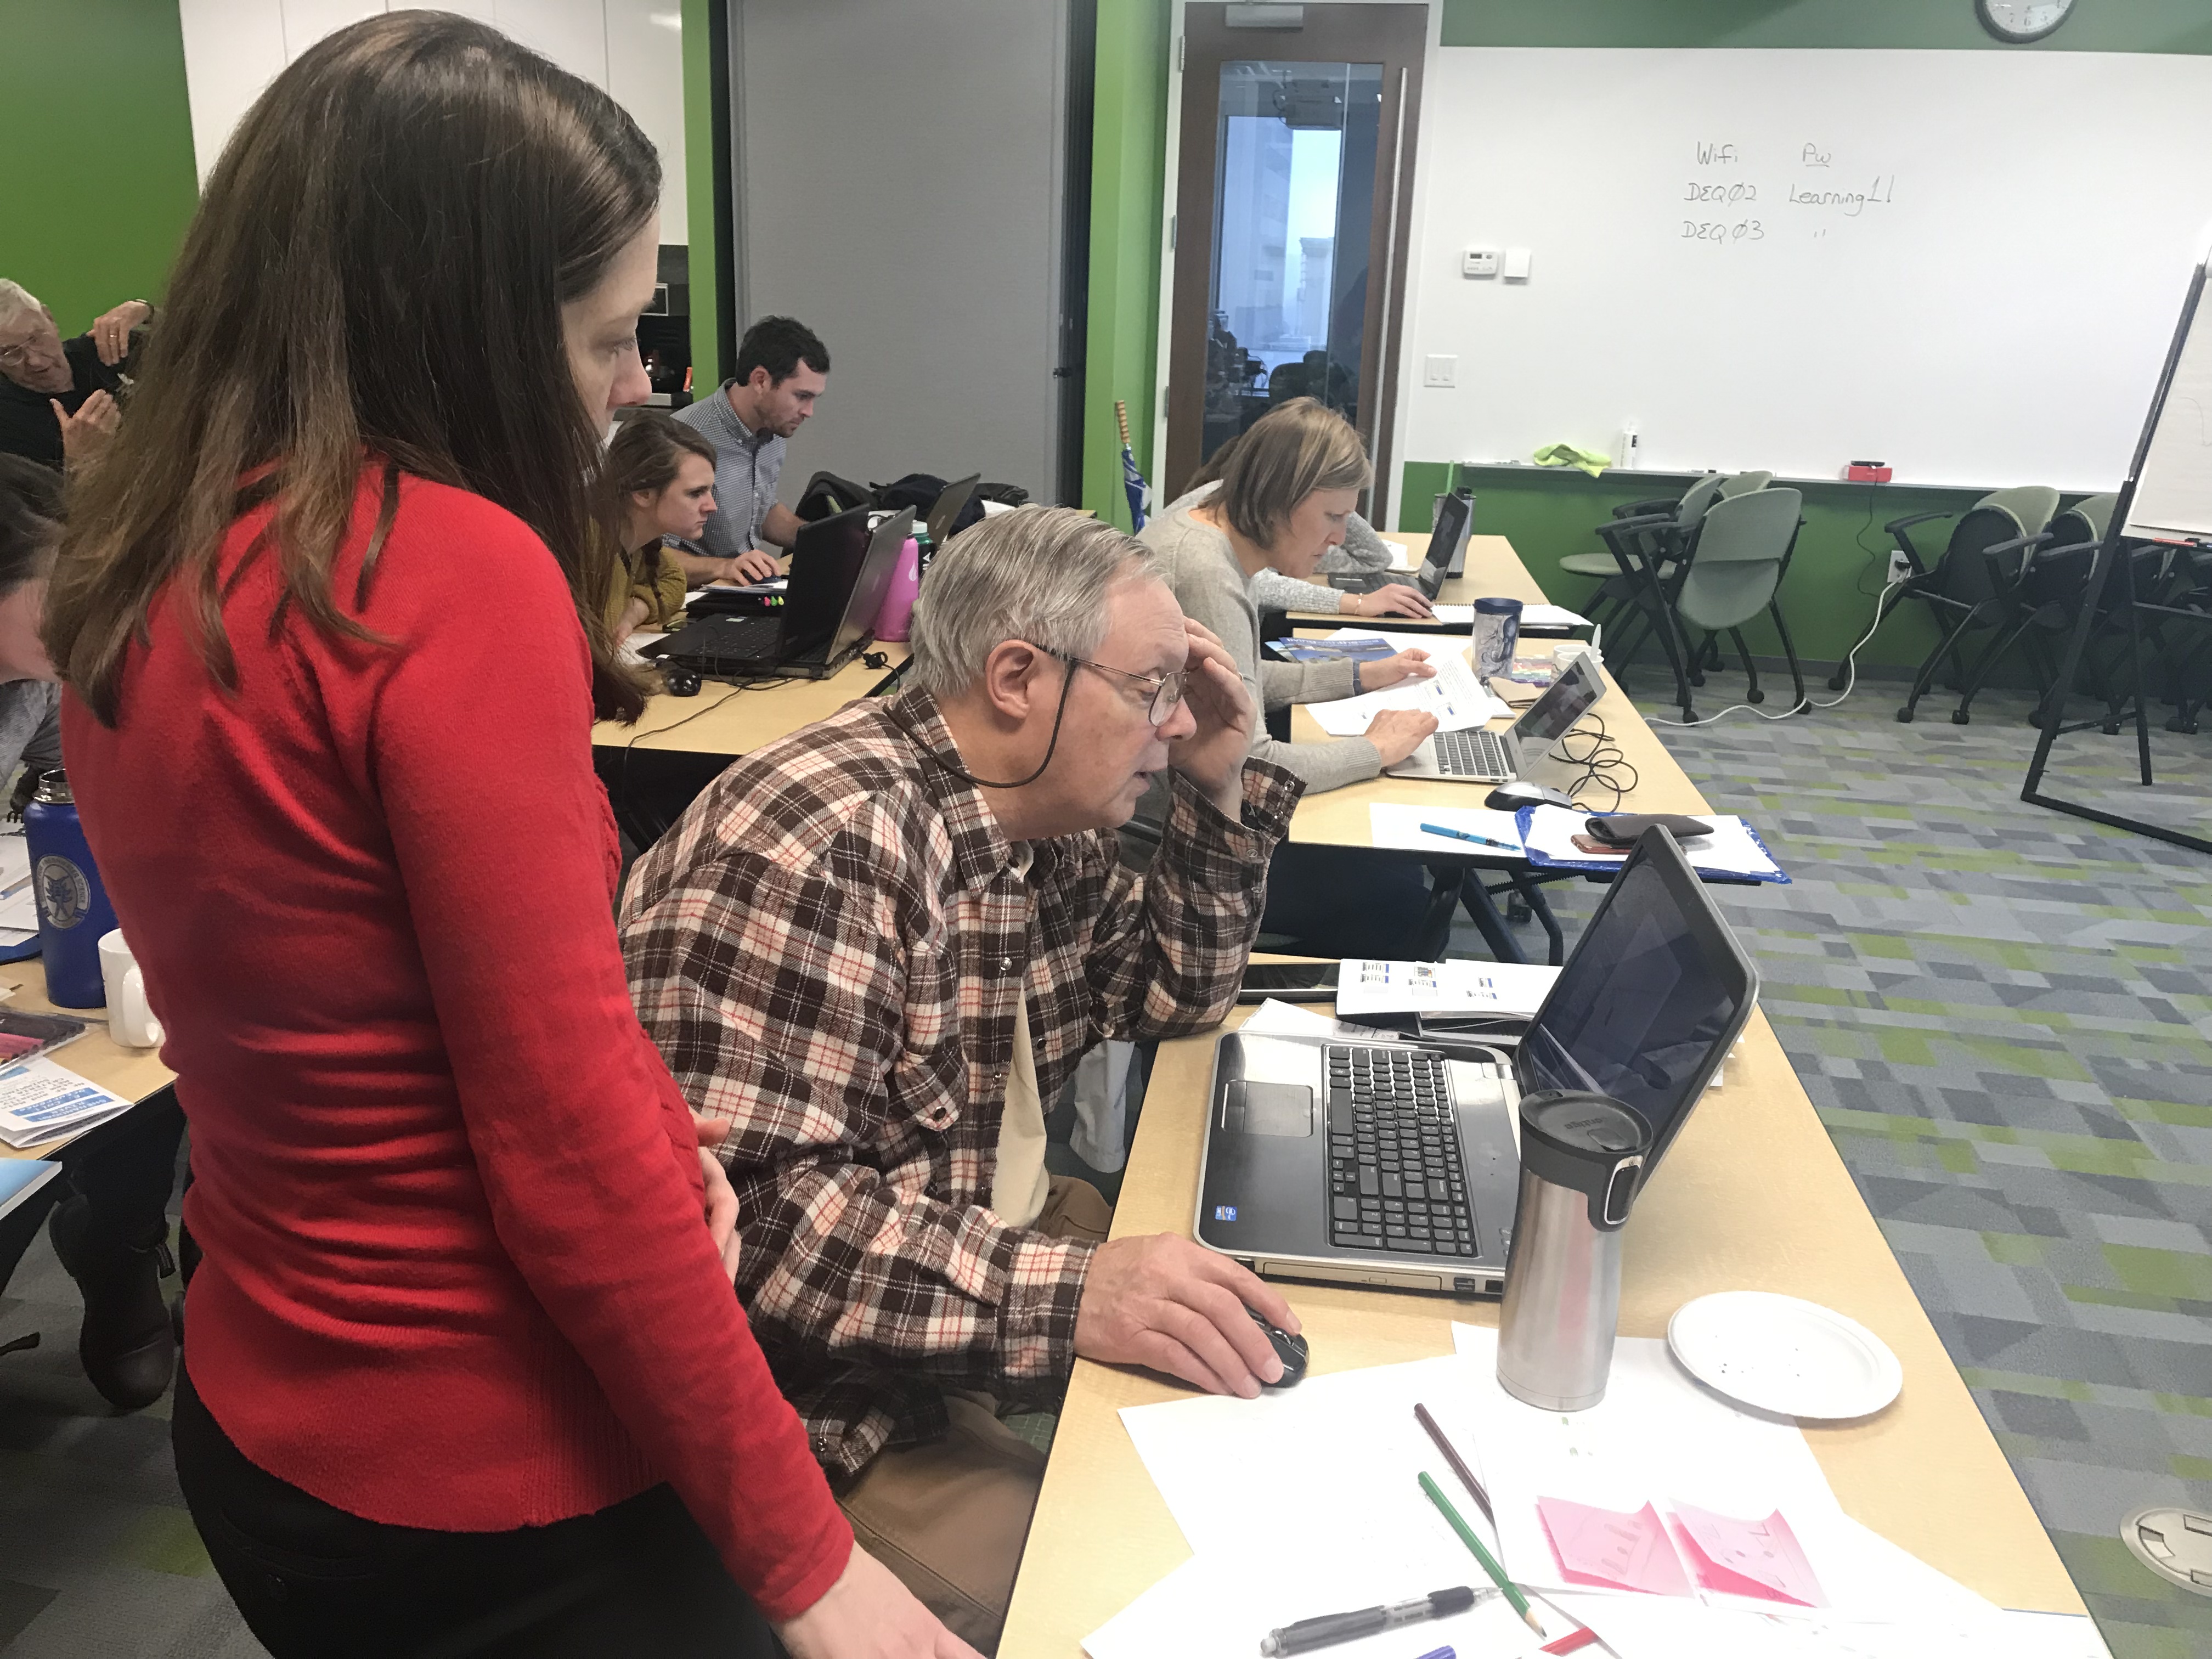
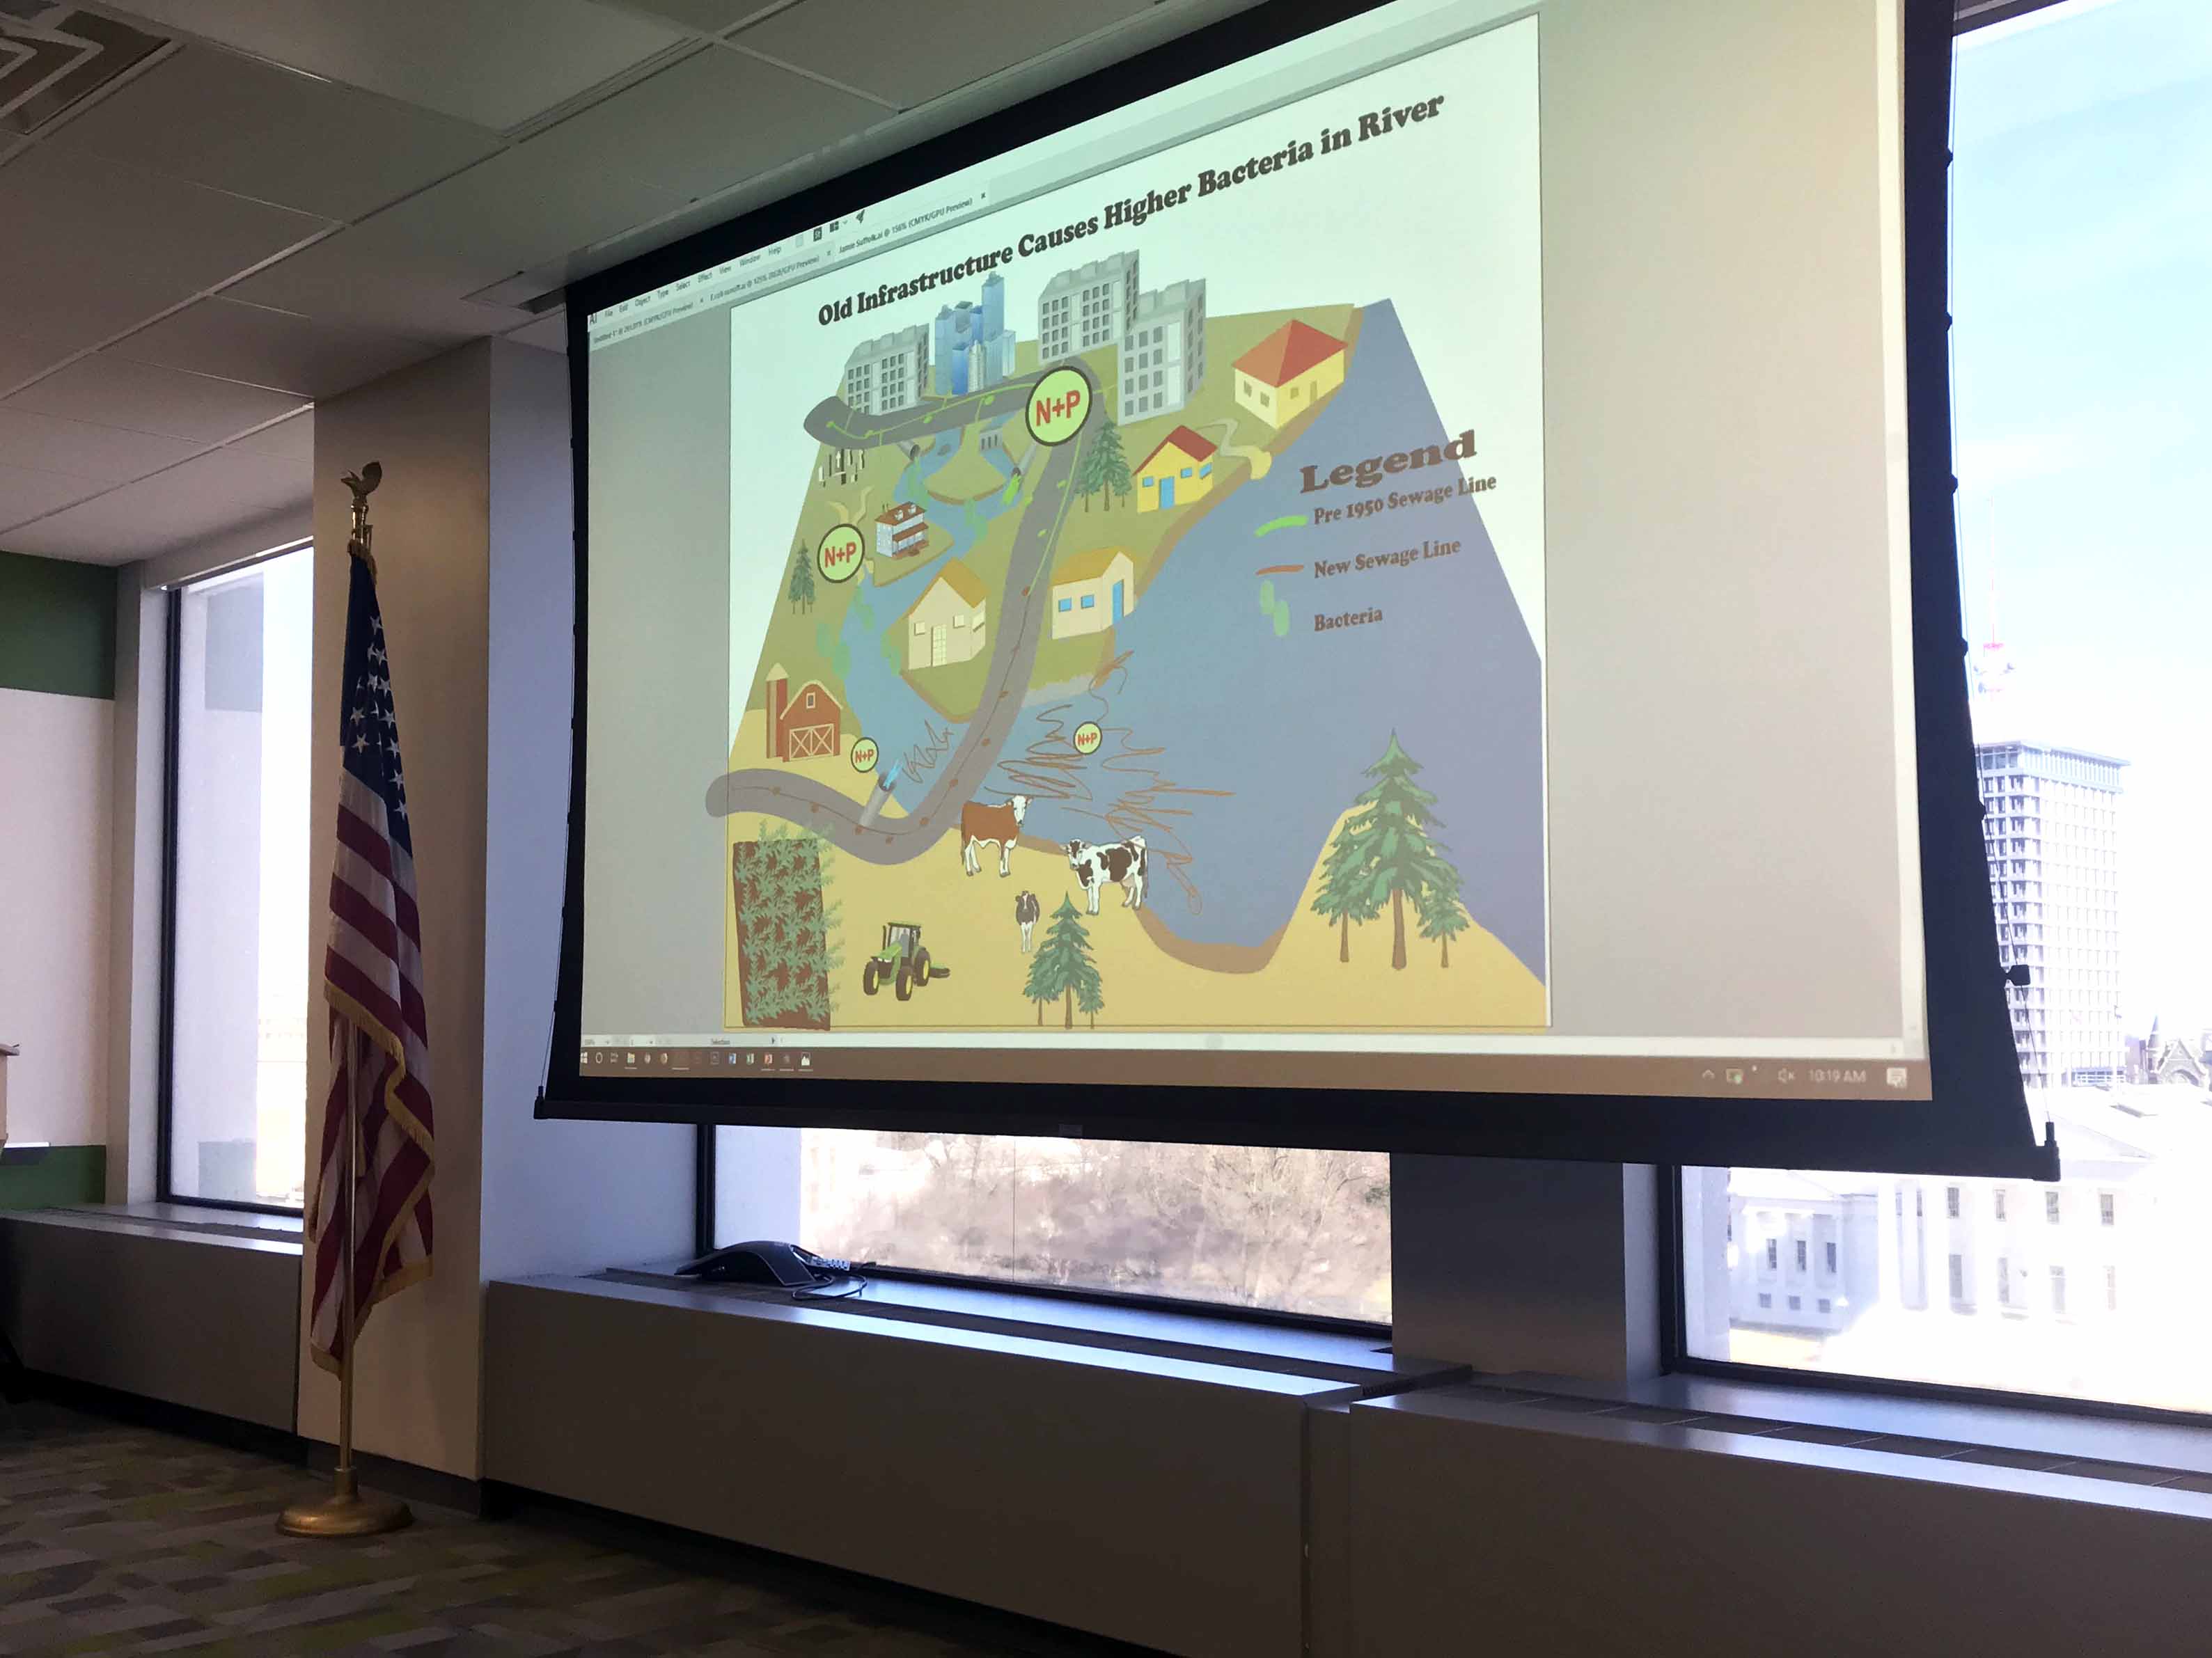
This past month, Caroline Donovan and I have been leading Introductory Data Interpretation workshops as part of the CMC. We held a course at the Virginia Department of Environmental Quality office in Richmond, VA on Feb 12-13th, and one at I led our next module, which was primarily focused on conceptual diagrams-what they are, why they are so effective, and IAN's best practices for how to make them. Our classic Conceptionary game proved to be an excellent starting point to get participants thinking about how to strategically use symbols in order to get a message across. Of course, getting to see everyone's competitive streak and silly drawings was also tons of fun. Armed with a vision for their own conceptual diagrams, we tackled the Adobe Illustrator tutorial in order to get people acquainted with the software and the IAN symbol library. Despite Illustrator having a notoriously steep learning curve, participants picked it up relatively quickly with Caroline leading the tutorial and Nathan and me fluttering around the room and providing one-on-one assistance. They were eager to explore the symbol library and began plucking out the symbols they wanted for their diagrams. By the end of the day, participants were well on their way to developing their visuals on topics ranging from agricultural nutrient runoff to sources of bacterial contamination. Unfortunately, despite our best efforts and participant In Richmond, the following day was dedicated mostly to science communication and individual product development. Caroline introduced the "and, but, therefore" framework in storytelling, followed by an activity where we guided participants as they drafted an ABT statement of their own to accompany their diagrams. It was trickier than participants expected. They were challenged to boil down the many things they wanted to say into a concise and generally compelling statement. Participants read what they had come up with aloud and received constructive feedback from the group, creating ample learning opportunity and sparking valuable discussions on the importance of a good narrative. The next module was centered around layout and design and Overall, I'd call the courses a great success and I am hopeful for the future communication efforts of our participants as they continue their efforts of engaging their local communities in stream monitoring. As the CMC continues to expand its network of monitoring groups, the value of strengthening these groups' ability to interpret their data and communicate their message becomes even more important. With that, I will close off with a Richmond hidden gem in science communication, courtesy of Virginia DEQ Quality Assurance Coordinator and citizen-science extraordinaire, James Beckley. Enjoy!
enthusiasm, our Carlisle course had to be cut short after an approaching snow
storm demanded Dickinson be closed for the day. Nonetheless, we remain
determined and are planning to hold a webinar with participants soon to cover
the second-day material.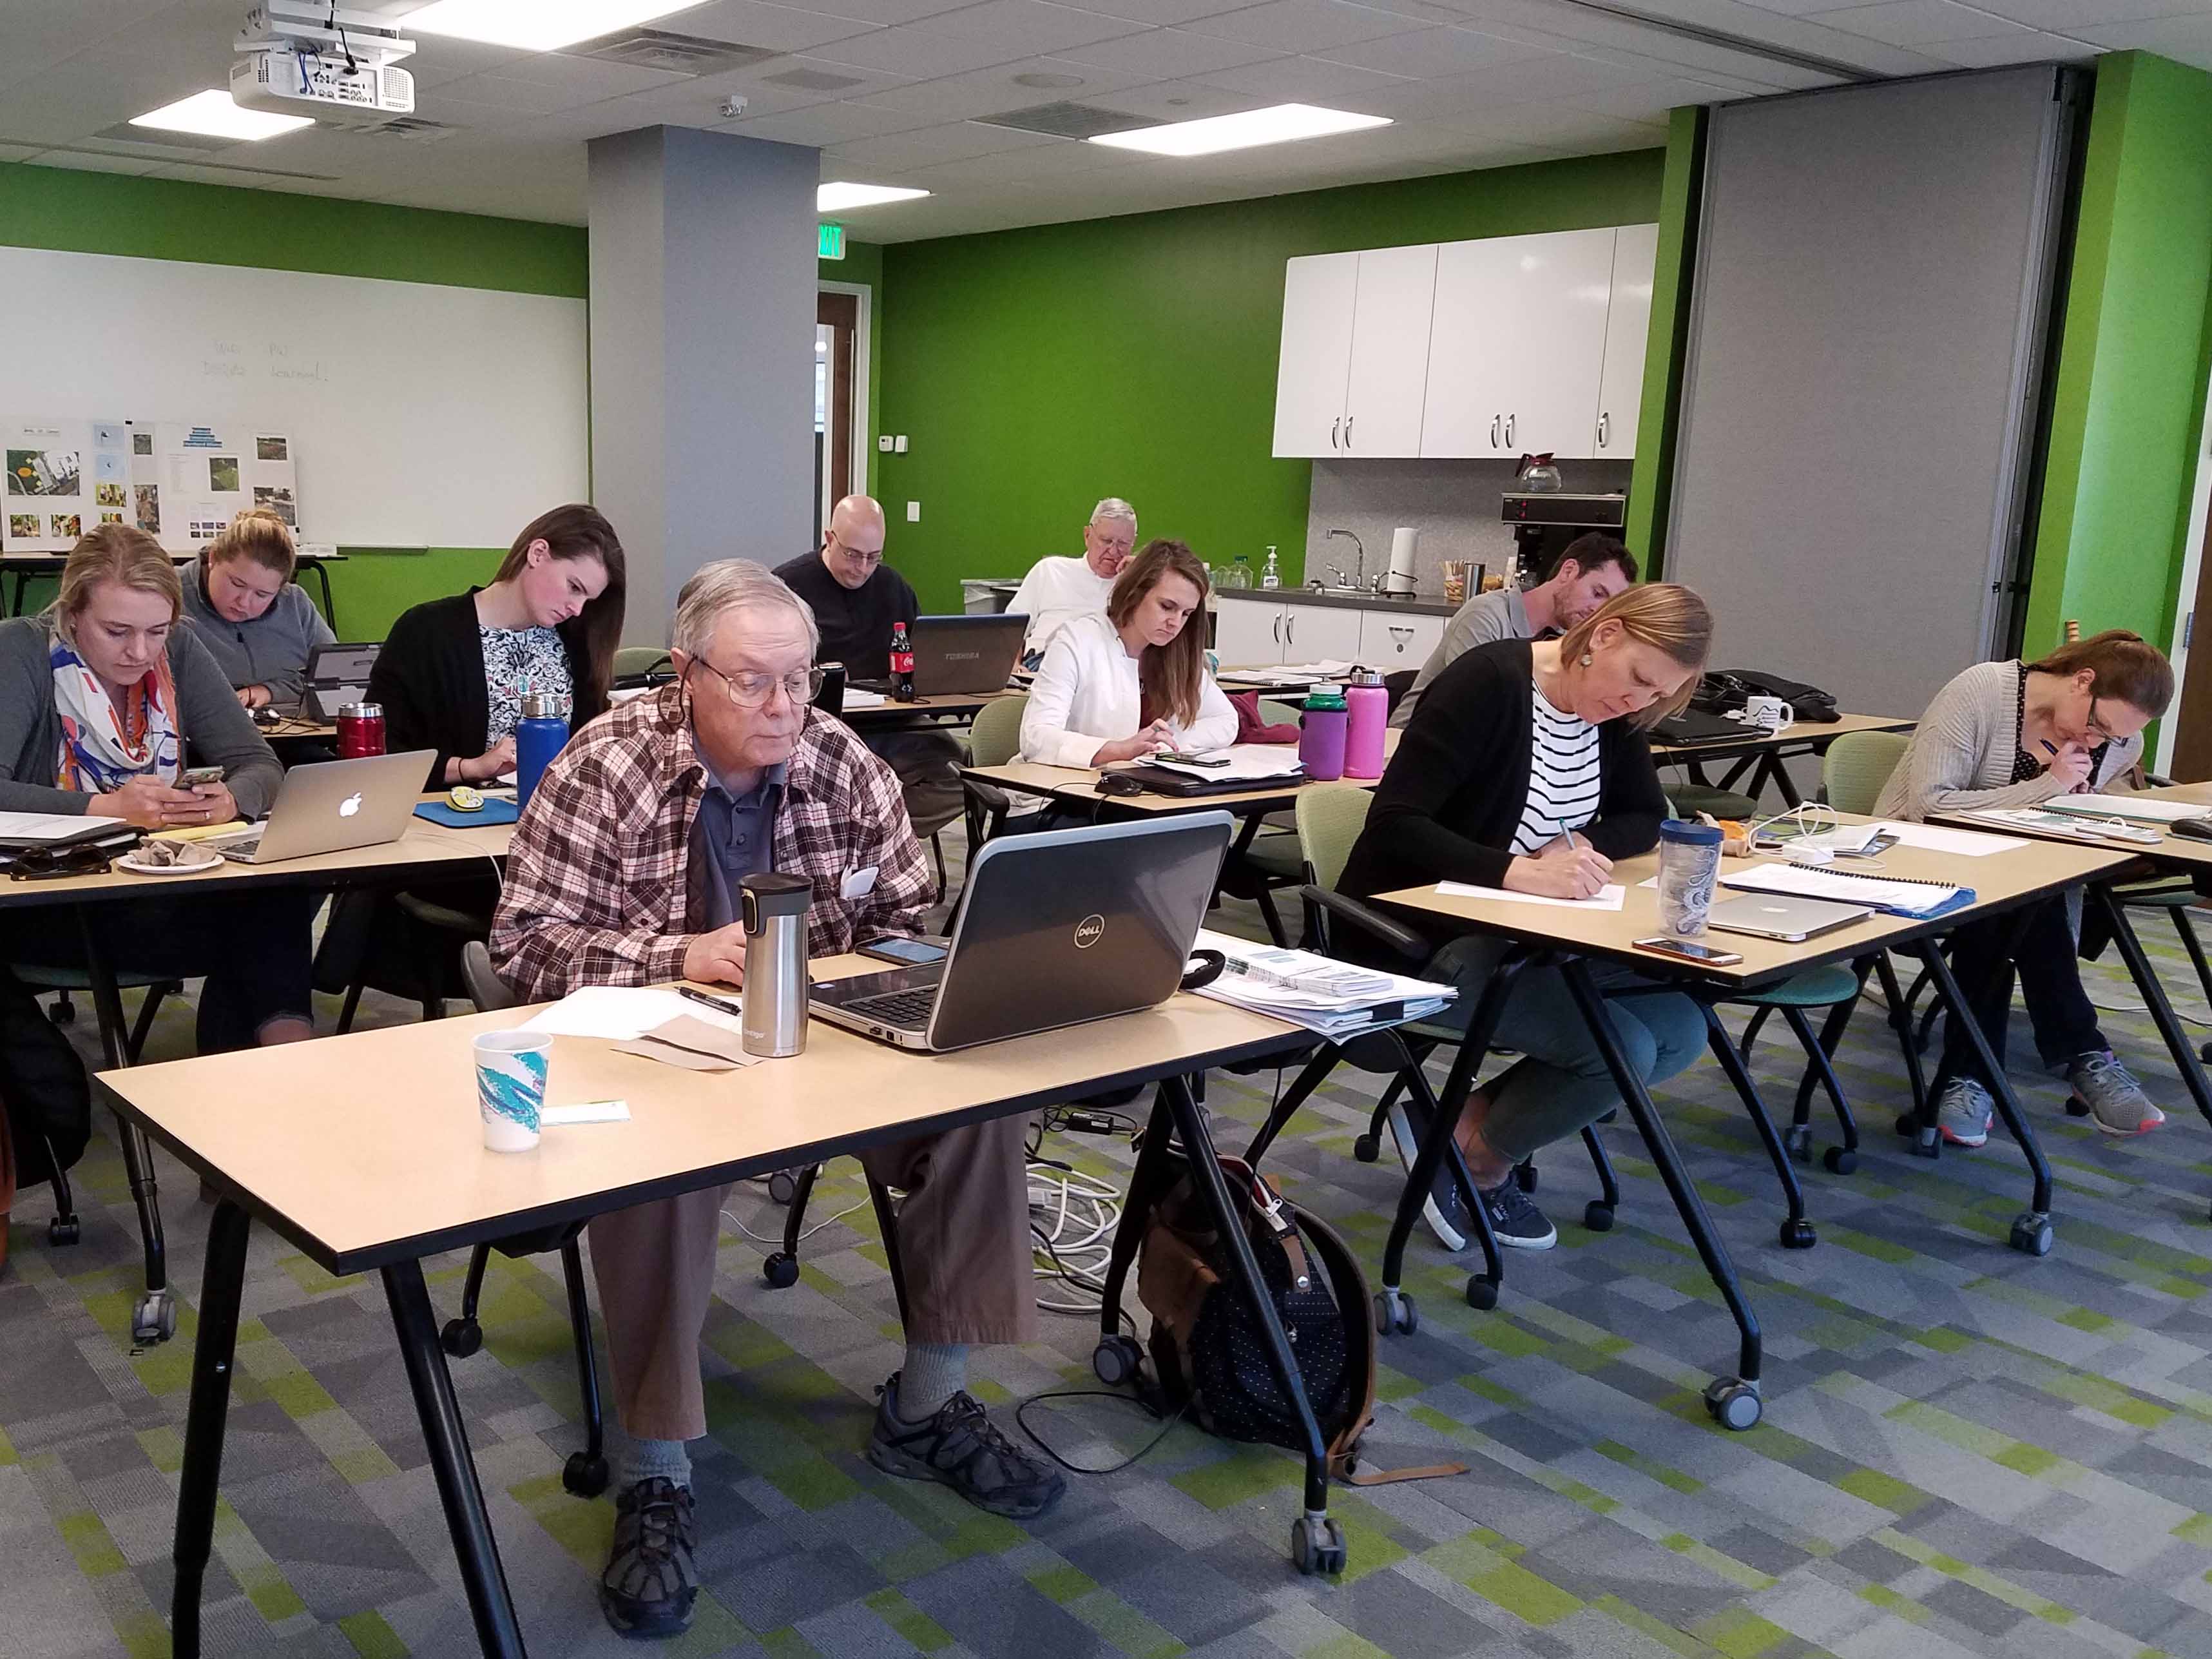
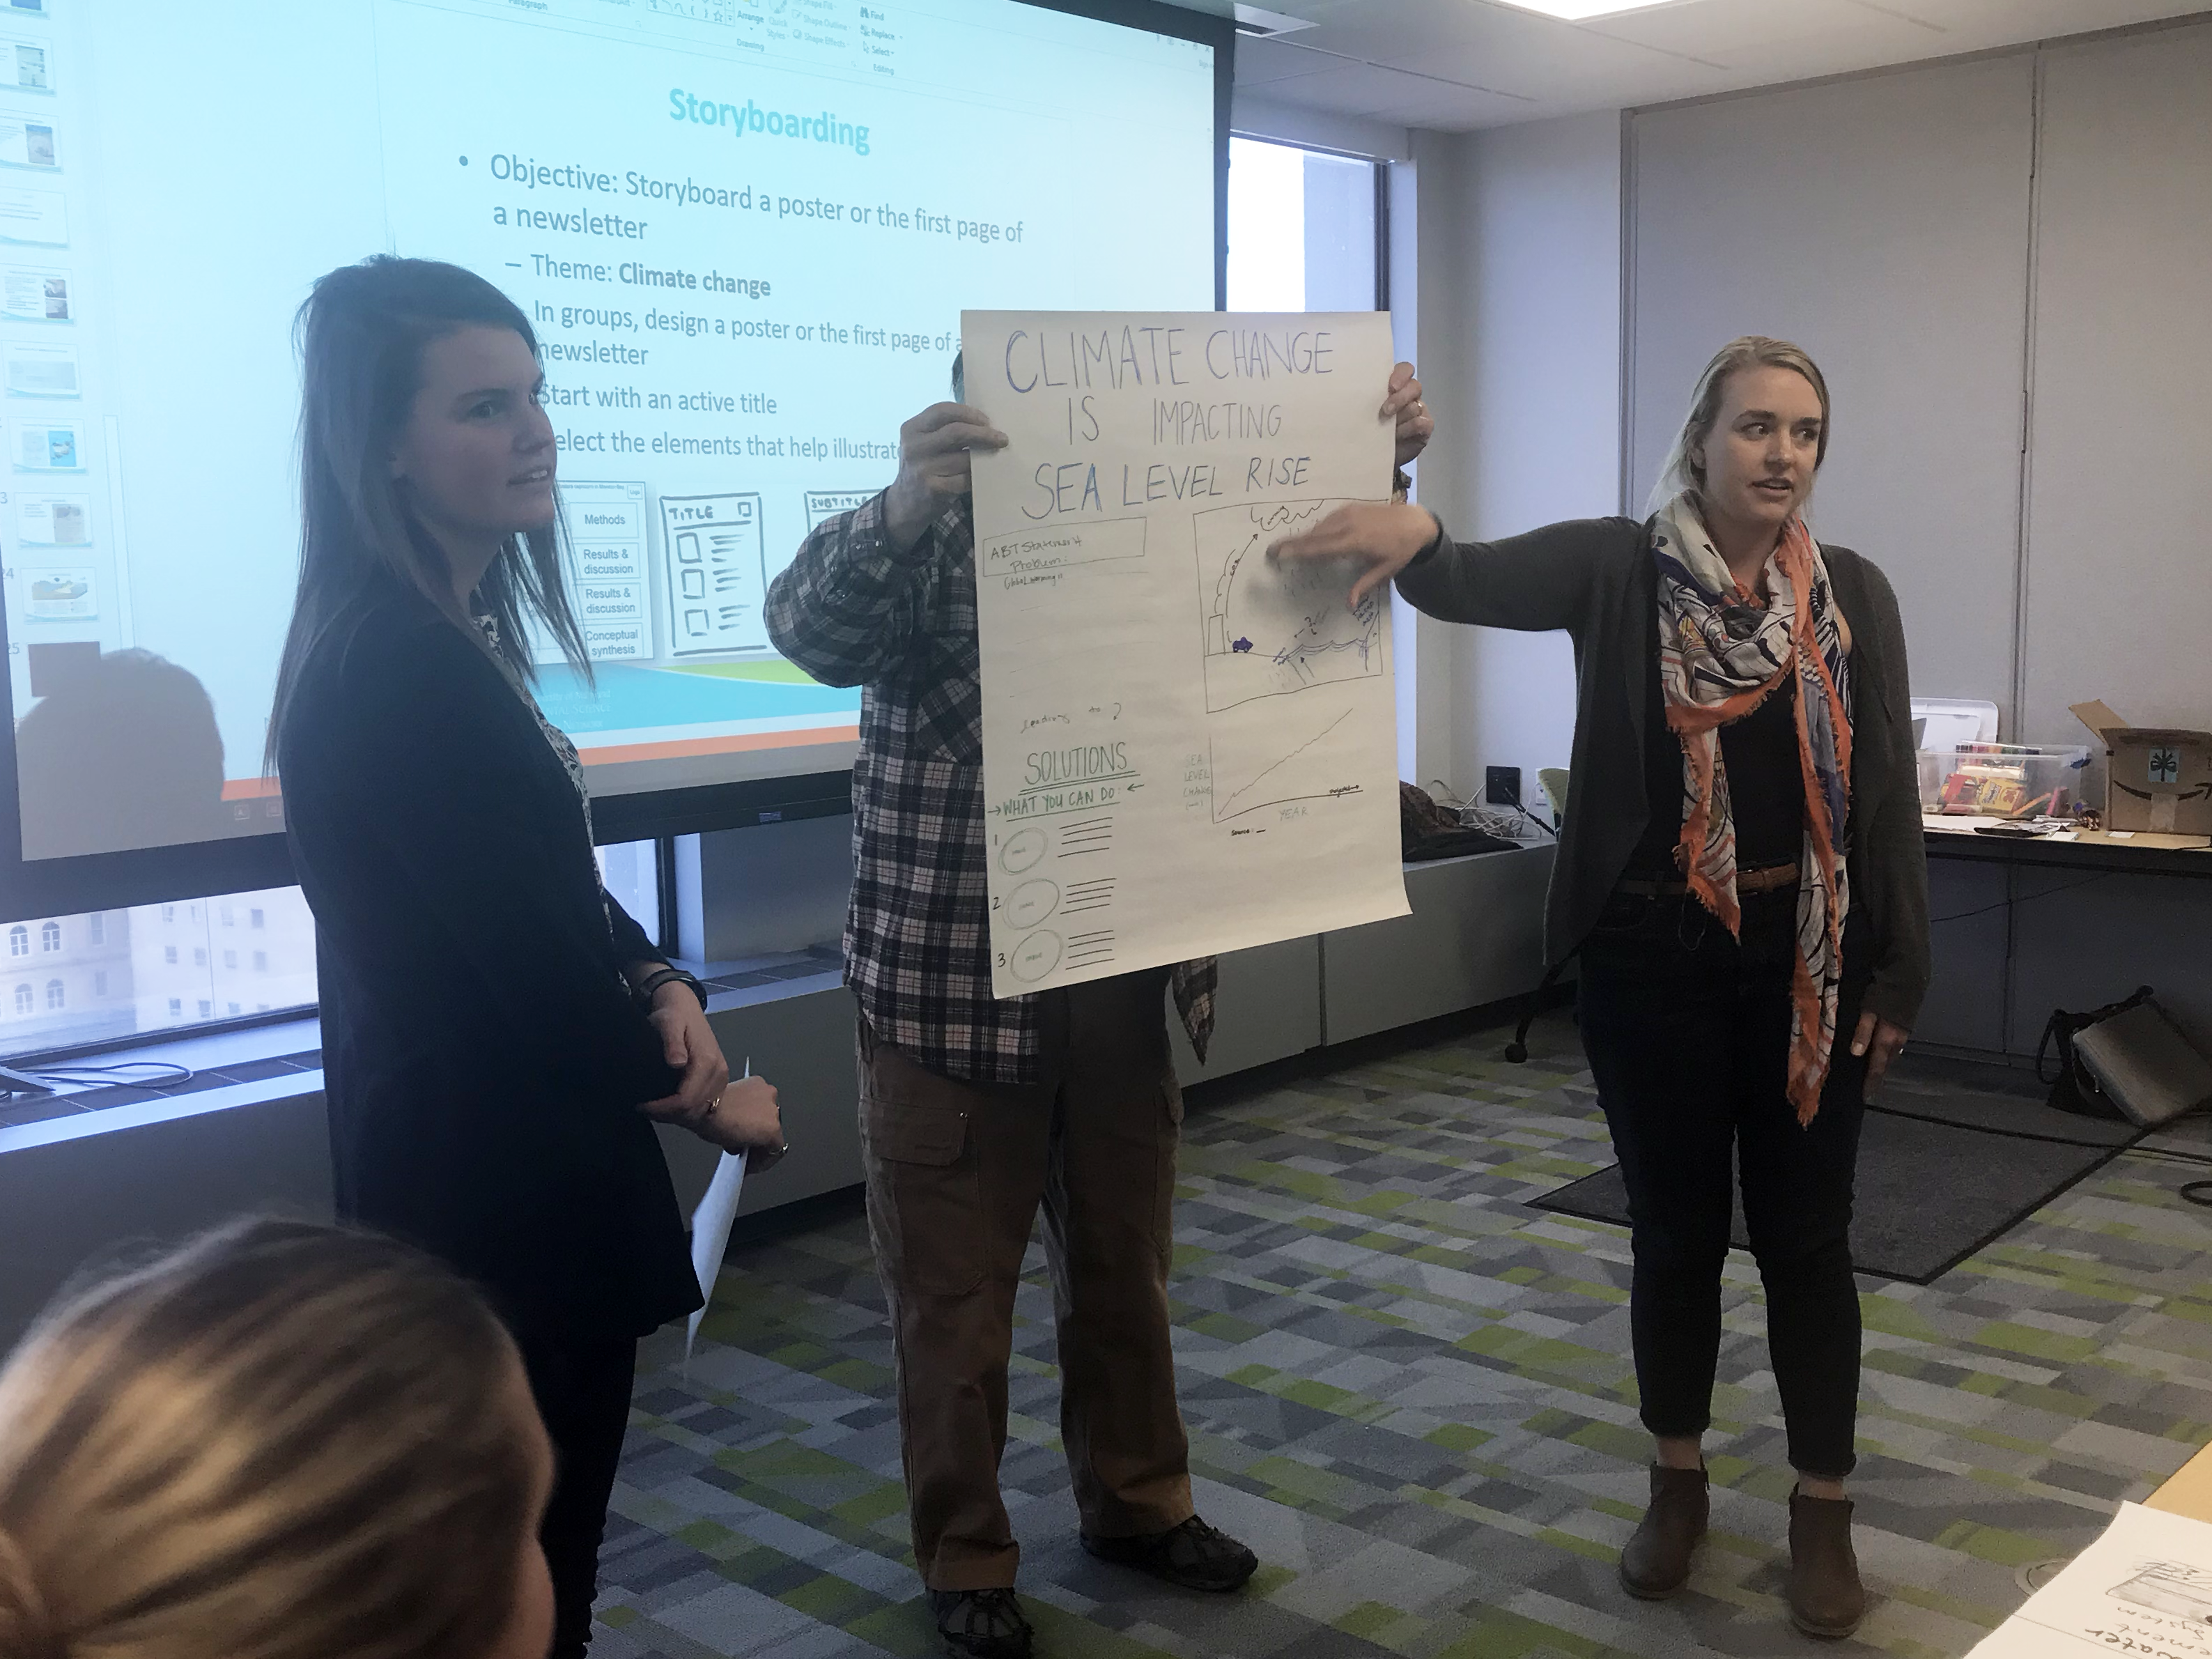
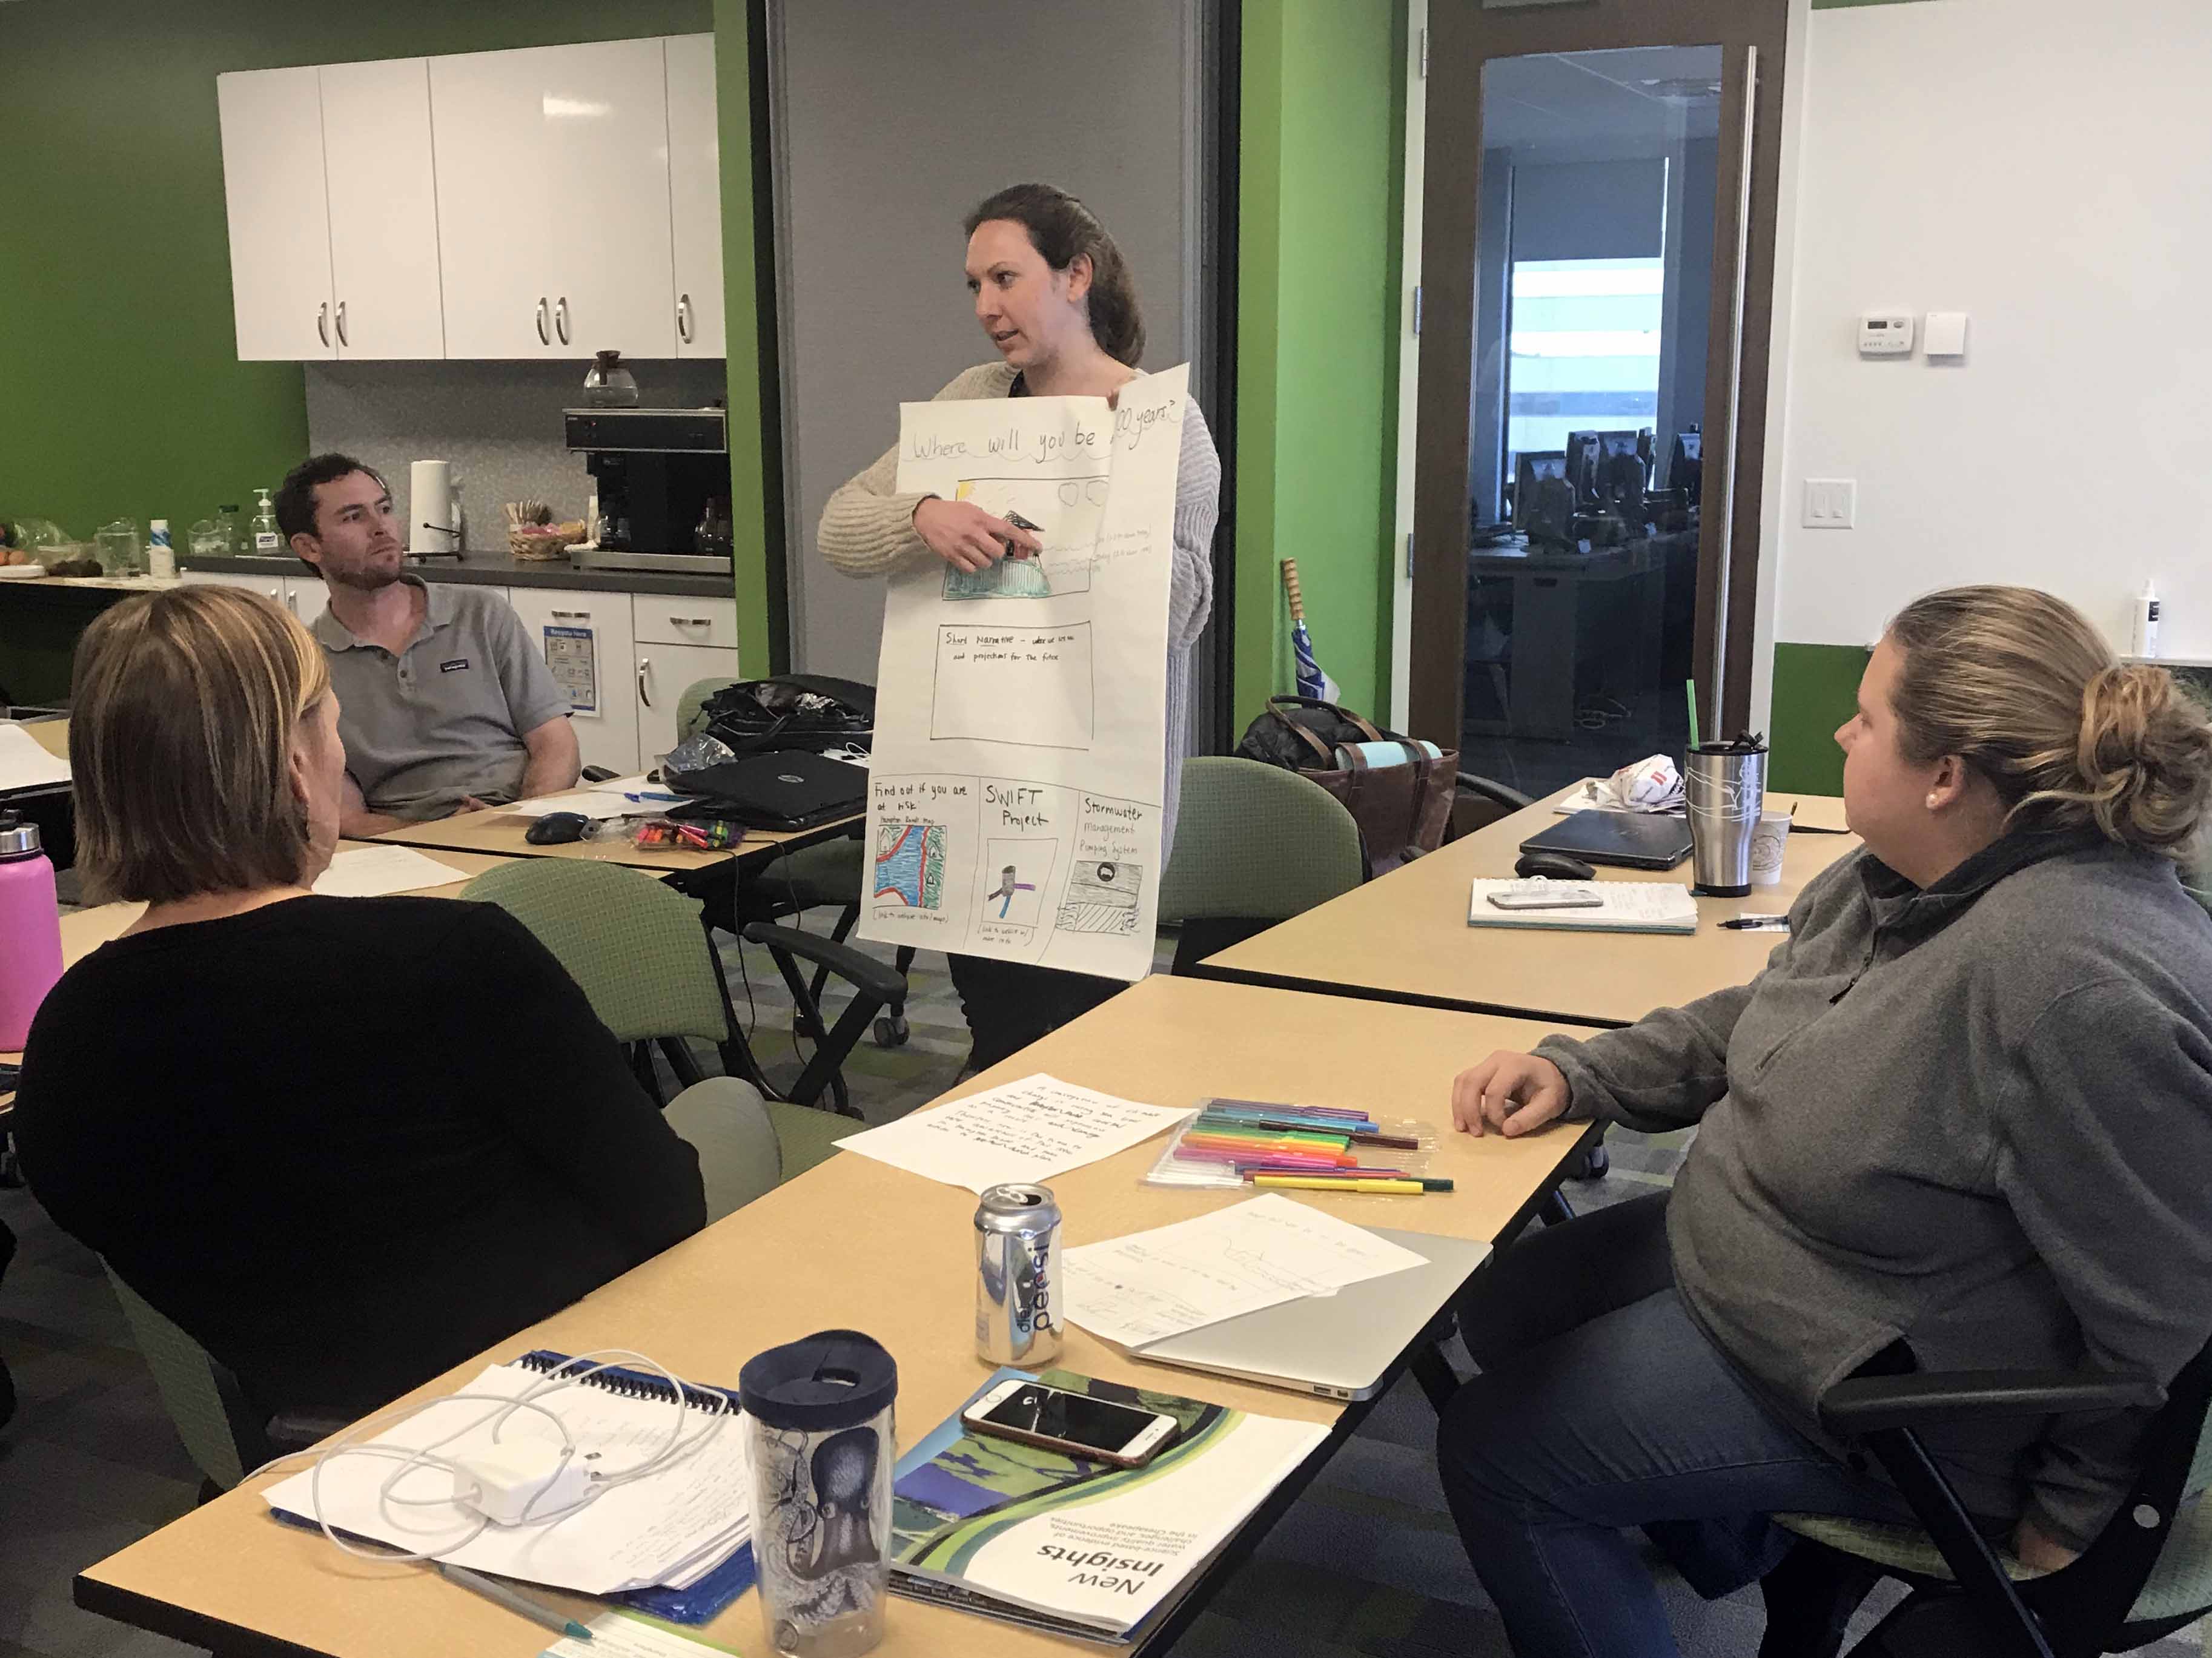
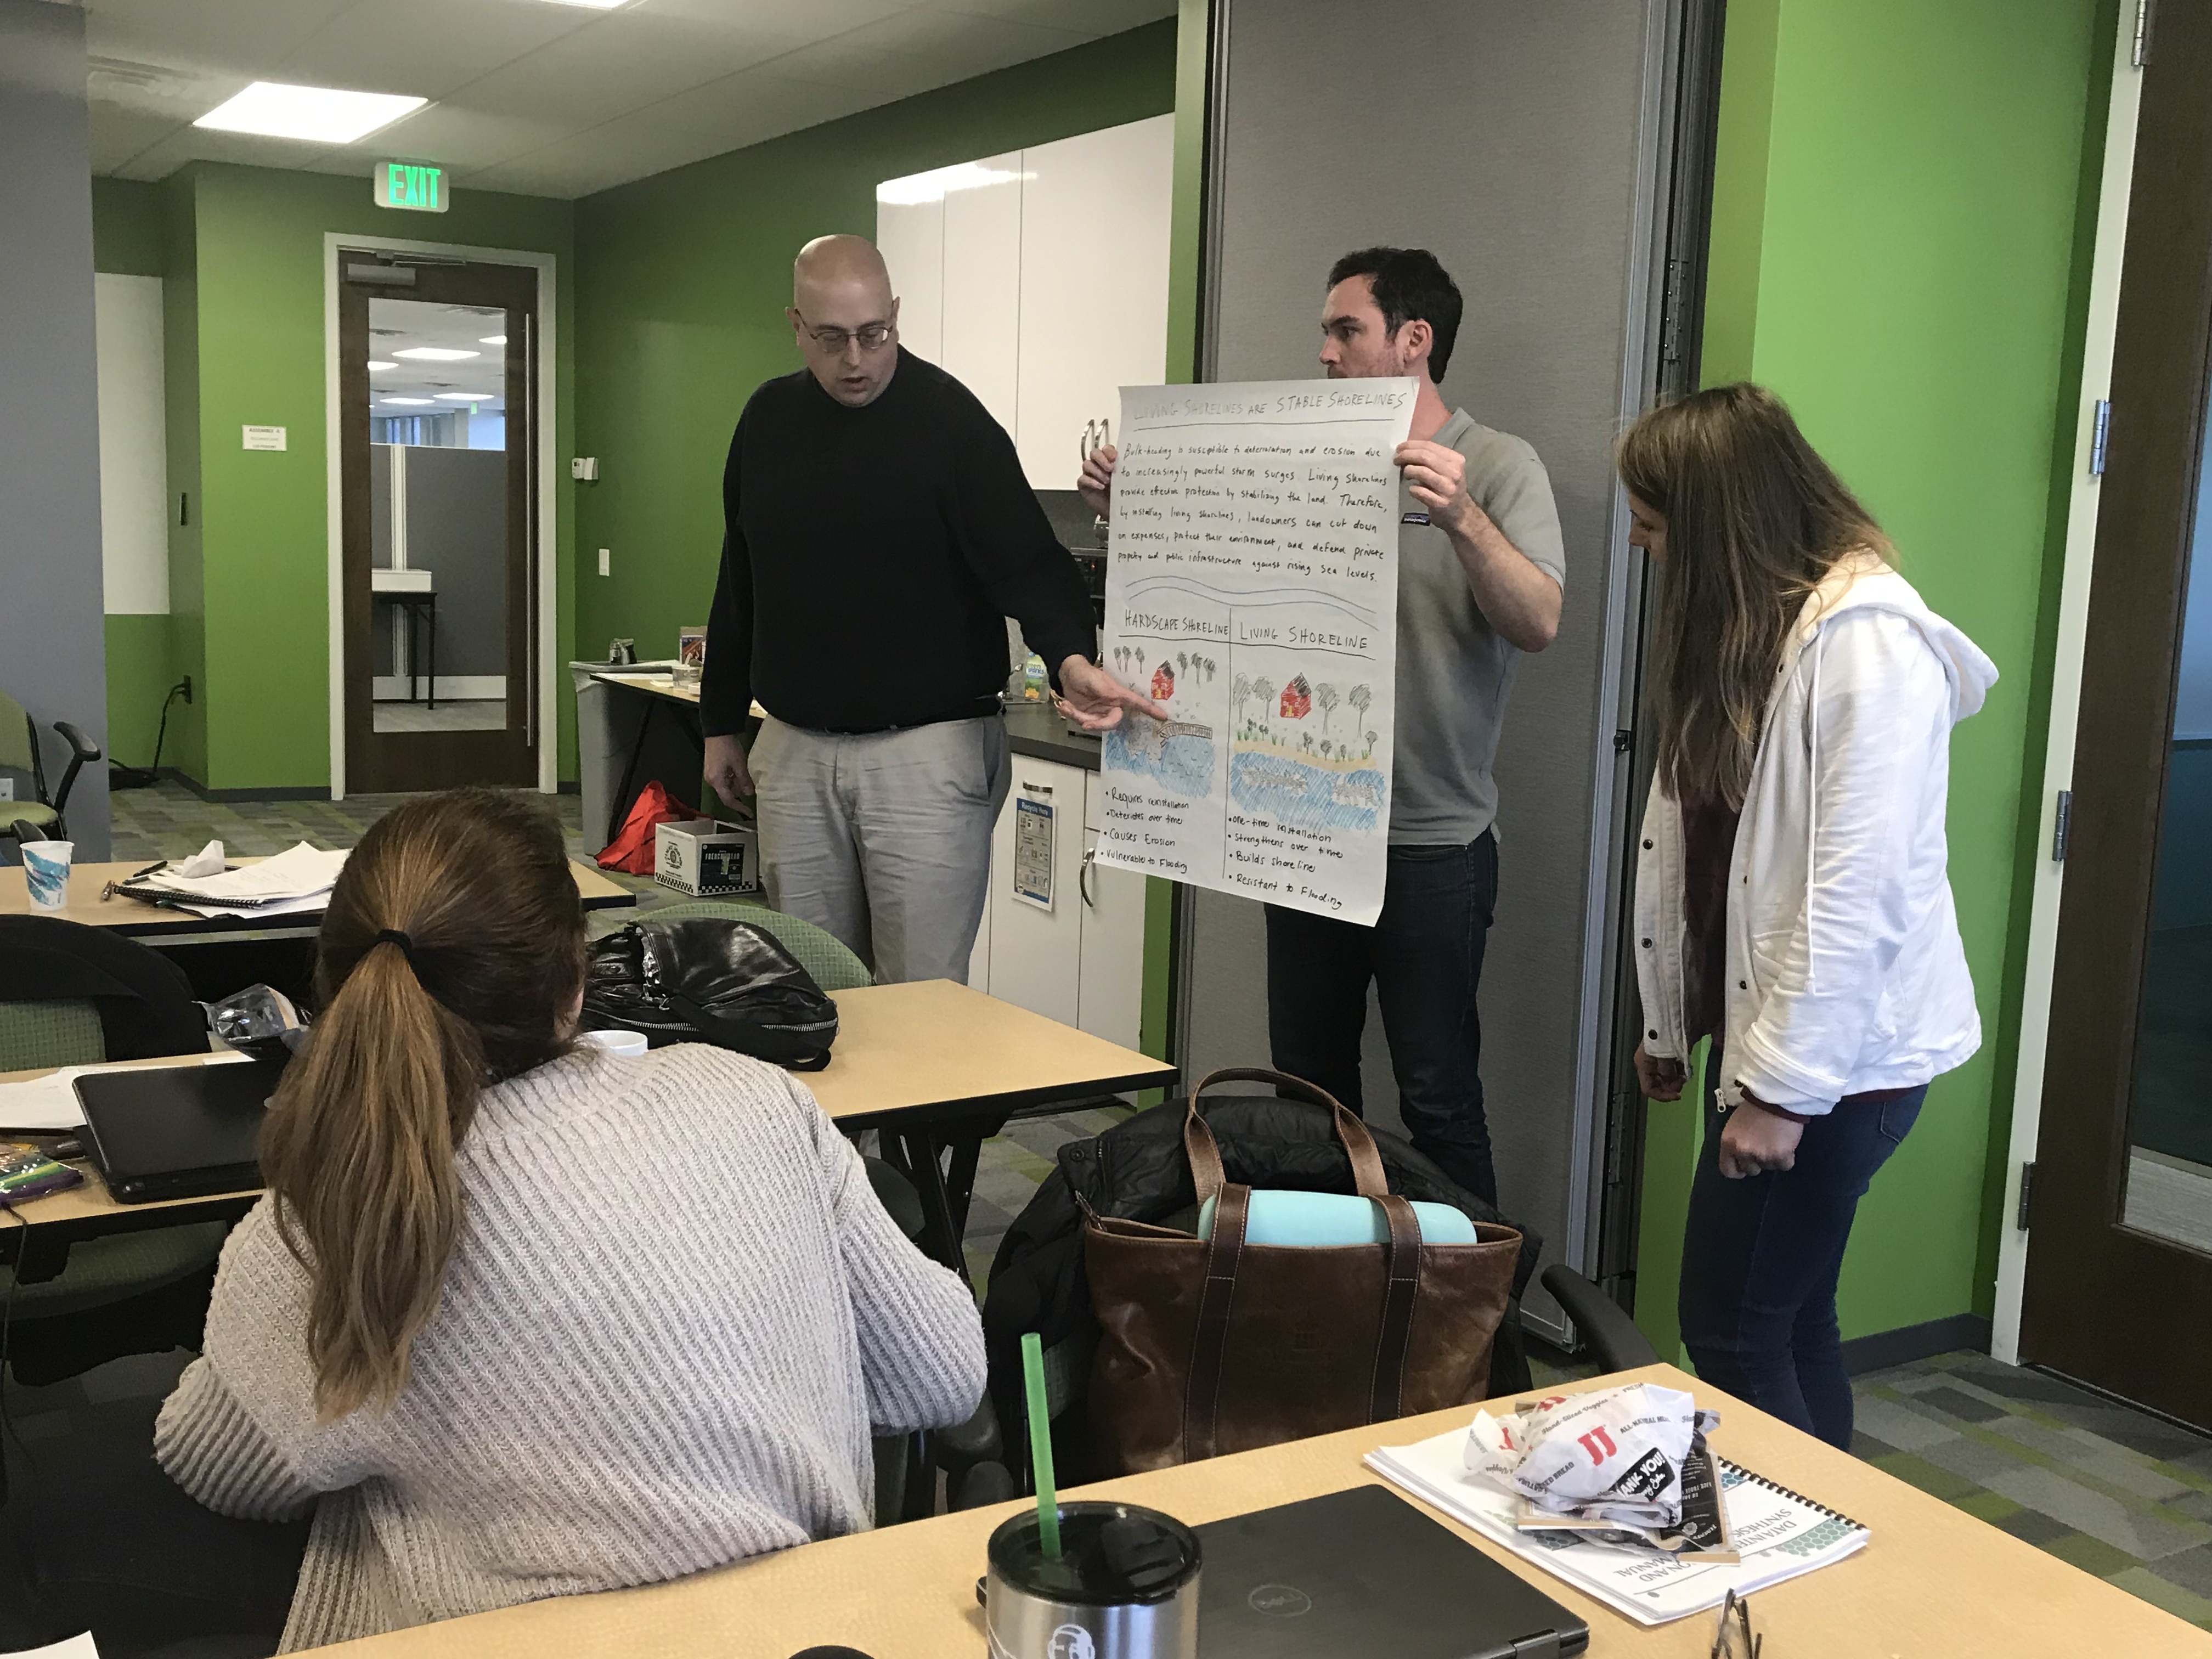
involved a small-group activity in which participants worked together to
storyboard a newsletter page. Again, artistic talent and creativity shone
brightly from our participants and we were proud to see the great designs they
came up with.