

Long term trends in Submersed Aquatic Vegetation (SAV) in Chesapeake Bay, USA, related to water quality
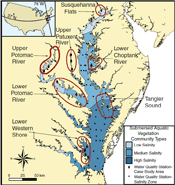 IAN and UMCES staff worked with a team led by Bob Orth from the Virginia Institute of Marine Science (VIMS) to produce this Estuaries and Coasts article, synthesizing trends in SAV abundance in Chesapeake Bay over the past 20 years. While abundance in low salinity areas has continually increased, mid salinity areas have shown increasing fluctuations and the high salinity areas of the lower bay have been declining for the past 15 years. Strong negative correlations suggested that high water column nitrogen is a major influence in declines of SAV abundance throughout Chesapeake Bay and can also be linked to some areas of recovery.
Protecting the Great Barrier Reef through improved land management
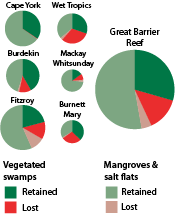 On July 21 and 22, IAN and EcoCheck participated in a workshop in Brisbane, Australia, to advance the goals of the Queensland Department of the Premier and Cabinet's (DPC's) "Paddock to Reef Program". The goal of the meeting was to discuss assessment and integration options for catchment, pollutant loading, and marine ecosystem data from the Great Barrier Reef. The program aims to prevent degradation of reef ecosystem health by reducing key pollutant loads through improved land management activities. IAN and EcoCheck have been working with DPC since May 2010 to integrate data and develop communication products for technical and summary reports for the Great Barrier Reef and six sub-regions.
Eastern oyster (Crassostrea virginica) δ15N as a bioindicator of nitrogen sources: Observations and modeling
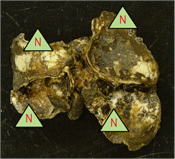 This paper from Ben Fertig's PhD, published in Marine Pollution Bulletin, details the use of stable nitrogen isotopes (δ15N) in the eastern oyster (Crassostrea virginica) to identify nitrogen sources. This study (1) determined that five individuals represented an optimal sample size; (2) verified that δ15N in oysters from two locations converged after shared deployment to a new location reflecting a change in nitrogen sources; (3) identified required exposure time and temporal integration (four months for muscle, two to three months for gill and mantle); and (4) demonstrated seasonal δ15N increases in seston (summer) and oysters (winter). As bioindicators, oysters can be deployed for spatial interpolation of nitrogen sources, even in areas lacking extant populations.
Ben Fertig became Dr. Ben Fertig on 6 July 2010
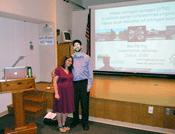 Ben Fertig, graduate student, became Dr. Ben Fertig following his successful dissertation defense at Horn Point Laboratory on 6 July 2010. His thesis is titled "Stable nitrogen isotopes (δ15N) in the eastern oyster (Crassostrea virginica) as an indicator of nitrogen source". Ben gave a PowerPoint thesis summary (five years compressed into 45-minute talk) to a large gathering of Horn Point faculty and students. His slides provide a great case study of organization, clean graphics, active titles, use of animations (or builds), summary, and thought provoking ideas. As a result of this clear presentation, the audience questions were able to focus on broader implications and interesting ideas including identifying nitrogen sources, use of oyster growth data, and oyster/isotopes interactions.