

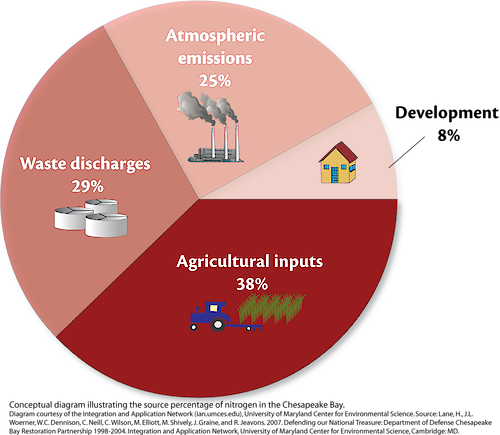
Nitrogen input in the Chesapeake Bay
Conceptual Diagram illustrating the percentage of nitrogen input in the Chesapeake Bay.
diagram degradation nitrogen development waste agriculture emissions source input| Property | Value |
|---|---|
| Author(s) | Jane Thomas |
| Author Company | Integration and Application Network |
| Date Created | 2007-01-01 |
| Album | Human > Environmental Degradation |
| Type | Graphic |
| Publication | Defending our National Treasure: A Department of Defense Chesapeake Bay Restoration Partnership 1998-2004 |
| Project(s) | Defending our National Treasure |
| Dimensions | 1000 x 870 |
| Filesize | 167.8 kB |
| Number of Downloads | 443 |
| Filetype(s) | PNG |
| License | Attribution-ShareAlike 4.0 International (CC BY-SA 4.0) |
| Required Attribution | Jane Thomas, Integration and Application Network (ian.umces.edu/media-library) |