

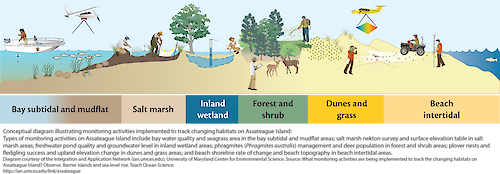
Monitoring Activities to Track Changing Habitats on Barrier Island
Conceptual diagram illustrating different monitoring activities implemented on Assateague Island to track changing habitats. Monitoring activities - which are habitat specific - include water quality, seagrass area, salt marsh nekton survey, surface elevation table, plover nests and fledgling success, upland elevation change, shoreline rate of change, and beach topography.
diagram monitoring habitat change barrier island climate assateague water quality seagrass area salt marsh nekton survey surface elevation table plover nests and fledgling success upland elevation change shoreline rate of change beach topography| Property | Value |
|---|---|
| Author(s) | Jane Hawkey |
| Author Company | Integration and Application Network |
| Date Created | 2011-08-23 |
| Album | Human > Science/Research |
| Type | Graphic |
| Project(s) | Assateague Island National Seashore Climate Change |
| Dimensions | 4168 x 1454 |
| Filesize | 926.3 kB |
| Number of Downloads | 452 |
| Filetype(s) | PNG |
| License | Attribution-ShareAlike 4.0 International (CC BY-SA 4.0) |
| Required Attribution | Jane Hawkey, Integration and Application Network (ian.umces.edu/media-library) |