

Geographic scaling of report cards
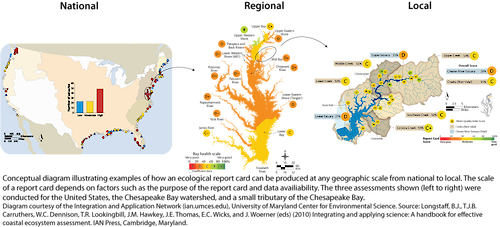
Conceptual diagram illustrating the geographic scale of an environmental report card. The three assessments shown are that of the Chesapeake Bay on a national, regional, and local level.
diagram illustration local regional national chesapeake bay data scale report card| Property | Value |
|---|---|
| Author(s) | Jane Thomas |
| Author Company | Integration and Application Network |
| Date Created | 2010-01-01 |
| Album | Human > Management/Restoration |
| Type | Graphic |
| Publication | Integrating and Applying Science: A handbook for effective coastal ecosystem assessment |
| Dimensions | 1001 x 454 |
| Filesize | 193.7 kB |
| Number of Downloads | 369 |
| Filetype(s) | PNG |
| License | Attribution-ShareAlike 4.0 International (CC BY-SA 4.0) |
| Required Attribution | Jane Thomas, Integration and Application Network (ian.umces.edu/media-library) |