


The IAN symbol libraries currently contain 3135 custom made vector symbols designed specifically for enhancing science communication products with diagrammatic representations of complex processes. You can download them individually, or as an entire package in AI, SVG, or PNG formats.
Download all 3135 symbols
AI version is for Adobe Illustrator and provides the symbols as palettes within the Illustrator tools. This is the best option if you have Illustrator.
SVG version is vector (fully scalable) and is the best option if you have other vector compatible software. The palettes format works with Inkscape's Symbol Dialog feature.
PNG version is convenient if you don't have any experience with vector editing software.
AI (palettes) SVG (individual) SVG (palettes) PNG (individual)Illustrator (AI)
* requires Adobe Illustrator CS5 or better
- Extract zip file
- Copy "IAN Symbols" folder to:
Windows
C:/Program Files/Adobe/Illustrator X/Presets/[language]/Symbols
MacOS
Applications/Adobe Illustrator X/Presets/[language]/Symbols
- Copy the IAN Swatches folder to your ...Presets/[language]/Swatches folder.
Notes:
- Prior to CS4, there was no language folder inside the Presets folder
- If you try to open these files directly, they will appear blank
- You may need to restart Illustrator for it to load the libraries
- If you are not familiar with Illustrator symbol palettes, see the "Accessing the Libraries" section below
SVG
* requires vector software such as Inkscape (free), Adobe Illustrator or CorelDraw
The zip package can be unzipped anywhere. Then simply open each file directly.
PNG
* can be imported into MS PowerPoint and Word, or edited with Adobe Photoshop etc
The zip package can be unzipped anywhere. The symbols in this version are raster which is great for quick use in documents, but they are not easily editable or scalable.
ACCESSING THE LIBRARIES
SVG and PNG
Simply open each file directly in your graphics software.
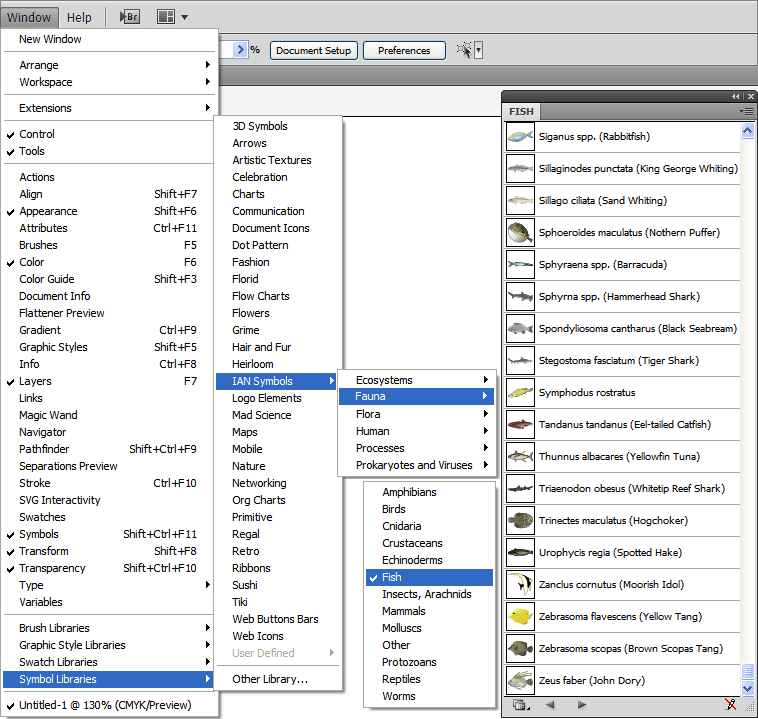
Illustrator (AI)
The symbols are accessed via Window > Symbol Libraries > IAN Symbols.
NOTE: If you open the illustrator files directly, they will appear blank.
EDITING A SYMBOL
When opening a symbol from the SVG or AI palette versions, or via the image library import in the online diagrammer, you need to break the link to the symbol before it can be edited.
- Illustrator: Right click > Break Link to Symbol
- Inkscape: Edit > Clone > Unlink Clone
You may also need to ungroup the symbol (often a few times) to be able to access all elements in the symbol.
Symbol Library Catalog (PDF)
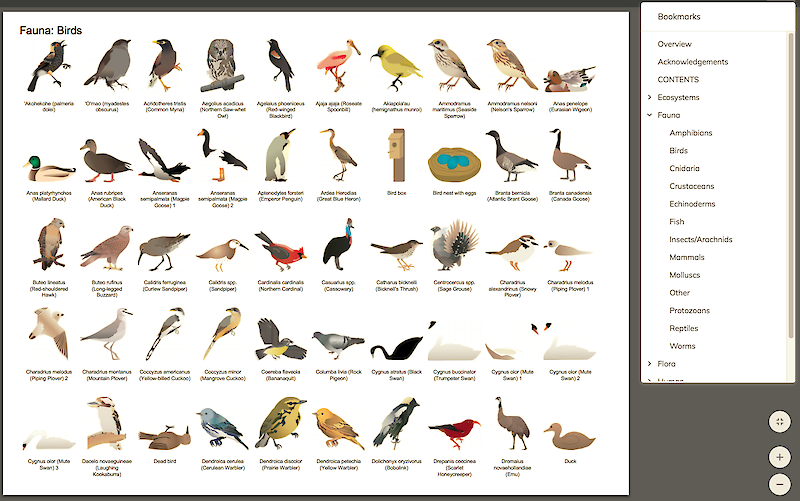
This PDF contains thumbnails of all the IAN Symbols split across the 56 albums. It is searchable by symbol title and also hyperlinks each thumbnail to its page in the IAN Media Library for easy downloading. A great quick reference guide.
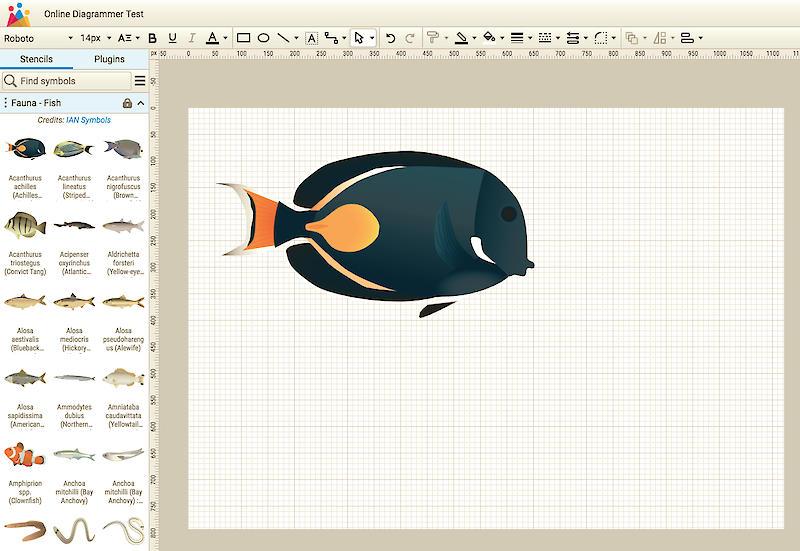
Online Diagram Creator
All of the IAN symbols are available to be used directly within Vecta.io
The IAN/UMCES Symbol and Image Libraries are provided completely cost and royalty free for any use, with attribution.
Required Attribution: [images/graphics from] Integration and Application Network (ian.umces.edu/media-library).
They are licensed under Attribution-ShareAlike 4.0 International (CC BY-SA 4.0). If an academic journal or other published medium has different licensing requirements, please email ian@umces.edu.


