Defining Report Card Indicator Thresholds to Achieve Healthy Outcomes
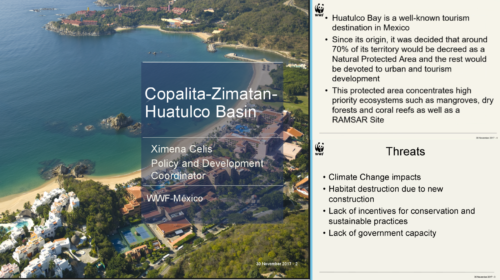
Katya Altman ·This week our class welcomed a new participant, Ximena Celis, from WWF - Mexico. She brought a new perspective to our discussion of report card thresholds and shared her environmental literacy presentation. Information about the course and other participants is available here.
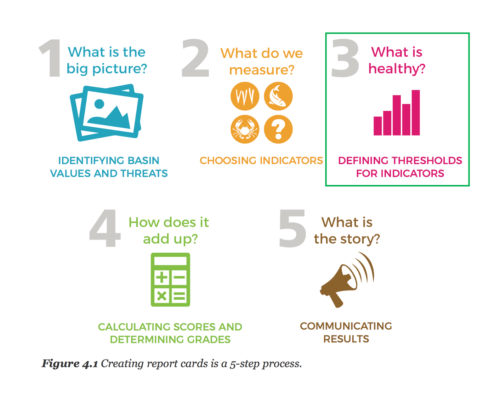
The UMCES-IAN online course, Healthy Rivers for All, is now in full swing. Over the past few weeks, we have discussed the first steps of the report card process, learning how to identify ecosystem values and threats and choose report card indicators. Values and threats identified in Step One are the villains and heroes of the story of a basin, while indicators selected during Step Two measure data that is most important for assessing and communicating a basin's story. This week's discussion centered around Step Three: define thresholds for the indicators. It is important to mention that Steps 1-3 are undertaken during the initial stakeholder workshop (or several workshops) and reworked as needed throughout the report card development process.
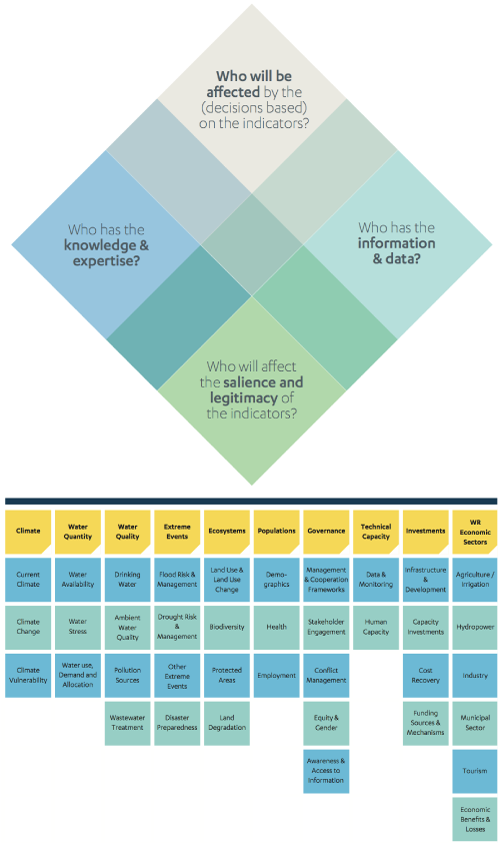
During the stakeholder selection process, it is important to consider not only who will be affected by the report card, but also who has the trust of the community, the capacity to evaluate the conditions in a basin, and access to relevant data and information. Stakeholders identify values and threats, which influence what indicators are ultimately used, as well as what thresholds are set for the analysis. The Integrated Water Resources Management (IWRM) indicator framework outlines categories of indicators and is a useful tool for choosing indicators. Once the indicators are selected, the stakeholders establish indicator thresholds. Indicator thresholds depend on the specific goals that the report card is trying to achieve in the basin.
The Practitioner's Guide to Developing River Basin Report Cards defines thresholds as "specific goals, upper or lower limits, or standards specific to each indicator beyond which the measured resources are known to change condition." Thresholds can be used to standardize data from different indicators defined during a workshop with stakeholders. Standardization and converting indicator data into a percentage can facilitate the comparison of the statuses of different indicators within a report card and across years.
Dr. Simon Costanzo, one of the instructors for our course, described two categories of thresholds. An exceedance threshold is a value above or below the "healthy range," at which negative impacts can be observed (e.g., body temperature, dissolved oxygen, pH). These values can be converted into percentages. In contrast, a proportional threshold is a value that is already in percentage form, and the percentage itself is used as a threshold (% of forested area, % of normal rainfall, % of the population in poverty). Exceedance thresholds can be converted into proportional thresholds (standardized) based on values of the basin's stakeholders.
Other thresholds to consider are:
- National or international guidelines
- Institutional goals
- Reference conditions
- Socio-economic requirements
- Historical benchmarks
- Professional judgment
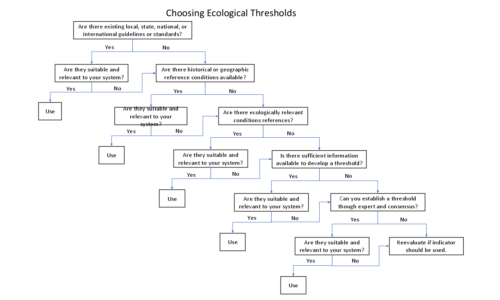
If no threshold is available, can one be developed? The decision tree diagram helps to explore the process of choosing ecological thresholds.
The process of defining thresholds for indicators can be challenging because we must ask two thought-provoking questions: 1) What numeric value should we compare the observed data to, and 2) What is the story the report card is trying to tell? For example, some established environmental quality standards could be too easy to achieve and don't reflect the desired state for the indicators. If there are not appropriate established criteria for a selected indicator, the best practice is to be transparent about your methods and use professional judgment and collective wisdom of the stakeholder group to create basin-specific indicators and thresholds.
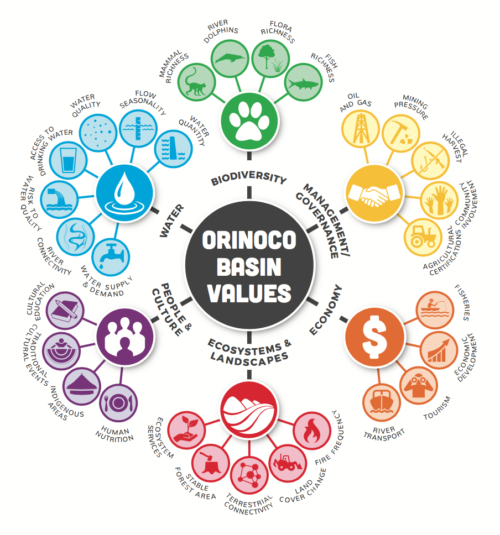
One such example is the Orinoco River Basin report card. Stakeholders identified an expansive list of potential indicators, but the list was eventually shortened to 29 indicators grouped in six categories shown in the diagram based on suitability and availability of data.

A highly participatory process of developing river basin health report cards guides stakeholders and decision-makers through the active engagement to describe and improve (or maintain) the health of the ecosystems. Indicators and goal-specific thresholds become a dashboard to monitor the health of the river basin. The central question of the report card process remains the same: What is the unique story of the river basin that the report card is trying to tell?
References:
Bertule, M., Bjørnsen, P.K., Costanzo, S.D., Escurra, J., Freeman, S., Gallagher, L., Kelsey, R.H. and Vollmer, D. (2017). Using indicators for improved water resources management - guide for basin managers and practitioners. 82 pp. ISBN 978-87-90634-05-6.
Costanzo, S.D., Blancard, C., Davidson, S., Dennison, W.C., Escurra, J., Freeman, S., Fries, A., Kelsey, R.H., Krchnak, K., Sherman, J., Thieme, M. Vargas-Nguyen, V. 2017. Practitioner's Guide to Developing River Basin Report Cards. IAN Press. Cambridge MD USA.
Next Post > Sharing tools for stakeholder engagement and collaboration at the Chesapeake Watershed Forum
Comments
-
Irina 6 years ago
Just a small precision..
In my opinion the paragraph titled "Other thresholds to consider are:" should not have the word "Other" but just "Thresholds to consider" as the list does not show "other" thresholds but rather types of thresholds that can be of the "exceedance type" or "proportional type" mentioned in the previous paragraph. -
Jodie 6 years ago
Thanks Katya. It was great to see where in the process that we are up to and a capture of what we've covered. I like how you pointed out that it's important to keep in mind the story - I think keeping the "WHY are we doing this" focus in the forefront of each step is important to making sure we end up with a clear effective message. Finding appropriate thresholds can be tricky, it would be great to get some feedback on the decision tree here from other report card producers!
-
Nancy Sheehan 6 years ago
Excellent summary with helpful graphics from the readings. I liked that you emphasized participatory processes to develop river basin health report cards.
-
Ximena Celis 6 years ago
Very good summery of what we saw last sesión. From what I read, I have a question: what expansive we have to be when choosing the indicators, can we just choose for example, water and biodiversity, and leave the other indicators (economy, governance, culture, etc.), or not?
-
Simon 6 years ago
Great! Well done.
-
Chanda 6 years ago
Thanks for an informative summary Katya!!
-
Kennedy 6 years ago
Good Job Katya. As you correctly mentioned indicator threshold depends on the what exactly the report card is trying to achieve hence the need to prioritize indicators and concentrate on a few that will enable you achieve your objective.
-
Atika 6 months ago
Thank you for sharing this great information with us, i really appreciate your post!