

Ecosystem health report card - how should we tell the story?
Kawawa Banda and Chinyawezhi Kakoma ·Kawawa Banda and Chinyawezhi Kakoma
Report cards are effective communications tools. They raise awareness of a river basin, explain the current health and challenges in a way everyone can understand, and create a public foundation to drive and track change. This week, our class on “Developing an Ecosystem Health Report Card” continued with step 5 of the report card process - “What is the story? Communicating results.” It focused on how to develop a communication strategy that engages relevant parties throughout the report card development process, and ensures report card findings are disseminated for greatest impact.
The class began with Dr. Bill Dennison outlining that the focus of the lecture would include some report card examples, a review of homework submissions and a discussion of our class project. Furthermore, our classmate Molly Ryan from GreenSmith Public Relations would be sharing her experiences and insights in communicating report cards. The eight example report cards that were discussed were as follows: Coastal Bay, Yucateca River Basin, Tennesse River Basin, Guanabara Bay, Laguna de Bay, Mississippi River Watershed, Orinoco River Basin and Chesapeake Bay.
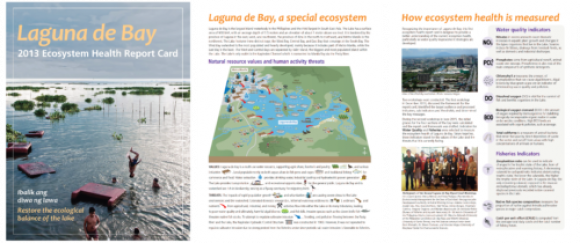
Typically all the report cards have commonalties that include a front cover with a resting satellite image, picture or illustration, a back with acknowledgements, logos and pictures of partners involved in the development of report card and then inside, the basin report map in an appropriate colour scheme denoting the indices, scores and an overall grade. Variations can be in the flap, for example, features stories celebrating partnerships (Coastal Bay), description of values and treats (Guanabara Bay – on sanitation and thrash), conceptual diagrams to describe the system (e.g. Yucateca – geological section, Laguna de Bay – natural resources values and human threats). In larger landscape, the report cards may have to be further produced at sub-catchment level such as the Orinoco. The key message here was that we must ensure that we feature emerging stories of which the basin report card keeps track of in subsequent reports e.g. Fisheries decline in the Laguna de Bay.
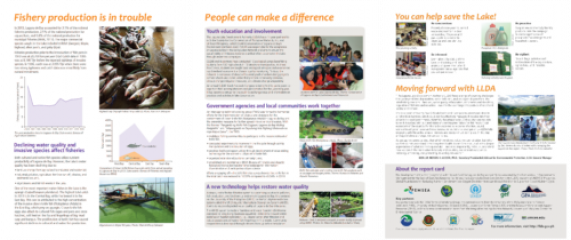
Further, it was important to highlight how people can get involved in fostering behaviour change hence communicating a positive message of the report. Since the report card bulletin is a summary, detailed can be placed on a websites over time (e.g. www.ecoreportcard.org).Videos can also be good aids in describing the basin reports. Typically, the launch of a report card must be done by a Governor or any authority that spur action on the basin report card results.
Molly Ryan talked about how to connect the report card news to the public. She emphasized the need to package the message in an appropriate manner for the audience. Think about the goal and motives and develop a message triangle. The message triangle has three elements – basin facts, report process and key finding and recommendations. For example in the Orinoco Basin, the interest was mainly in ecotourism and biodiversity.
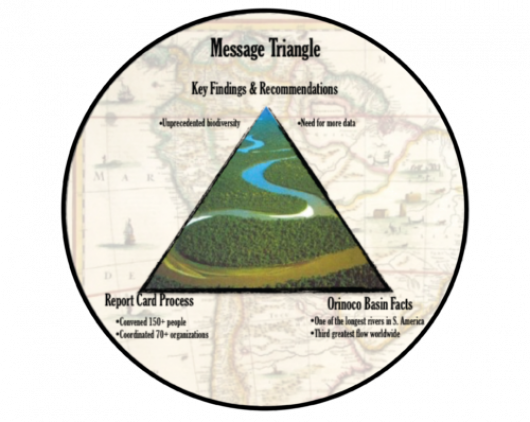
Key messages have to be developed from different points of view and stakeholder. The message must be as clear and concise as possible. Decide on the story angle in the narrative of the report card. This will help to show why the report card news is important and trigger a reaction from the target audience. Key messages were that media influences policy makers through creating a “buzz” on the issue which can lead to legislative change. Ensure the “correct” message gets out by being clear and concise advocating for positive change. Positive messages have demonstrated a likely influence on behavior change with a call to action then the old “doom and gloom” approaches of communicating scientific findings. Support with an external help in media and public relations helps to get the message out.
The ecosystem report card is a great communication tool that should instigate positive behaviour change through informed science-based decision-making. Therefore, the story in the ecosystem report card must be well packaged and supported by wide stakeholder consultation to ensure ownership, collective agreement and an appreciation of the context. Stakeholder consultation should not be underestimated as it can make or break the adoption of the report card. Join us in the next class for more on this!
Next Post > More Conversations with Randy Olson about the use of narratives in science
Comments
-
Ricardo 5 years ago
After planning, workshops, data analysis, etc., the form how we communicate and tell the story is of mayor importance. I think it's better to count with the support of graphic designers and specialized people with fresh ideas that may boost the attractiveness of the report card and the spread of our message.