

Public data is broad but interesting: ongoings at a data conference
Joe Edgerton ·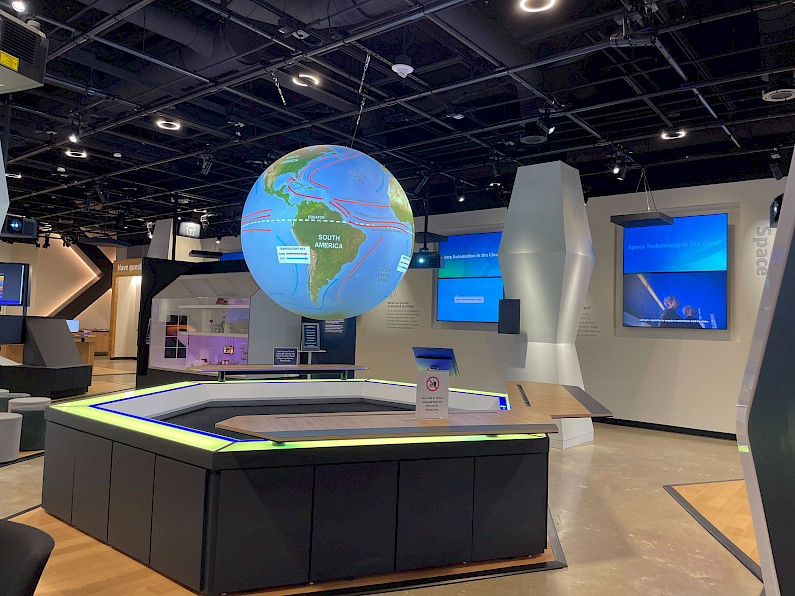
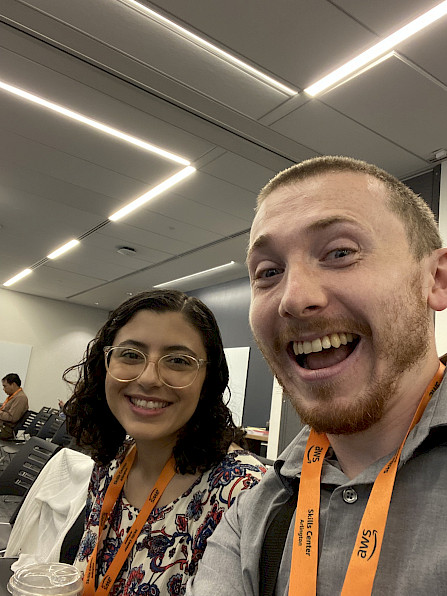
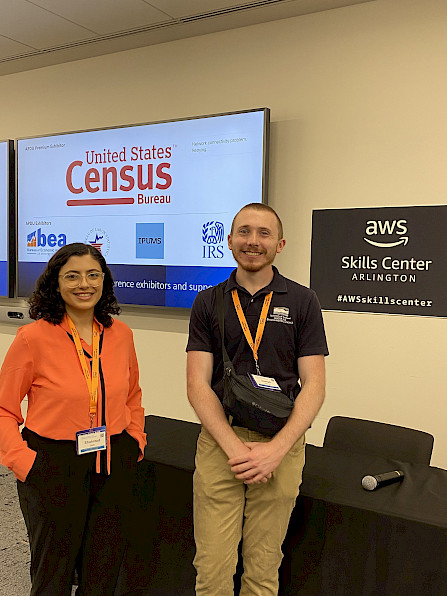
Walking past a closed Amazon Fresh store was a little disappointing for me; I wanted to at least try to buy a banana by simply grabbing one and walking out, but I guess it wasn’t meant to be. Just a bit further up the road was the Amazon Skills Center where my coworker Lili Badri and I would meet another 50 or so professionals at the annual Association of Public Data Users (APDU) 2023 Conference in Arlington, Virginia on July 25th and 26th. This is a conference dedicated to public data, both providers and users, and this year the conference theme was “Expanding the Universe of Public Data.” Vendors and users convene from all sorts of different agencies and organizations revolving around the public sector: U.S. Census, Bureau of Economic Analysis, Internal Revenue Service, Urban Institute, and others.
We at IAN largely use public data to build any one of our socio-environmental report cards, so Lili and I decided it would be good to investigate what this conference was about. However, we actually weren’t there solely because we were curious, we had participated in the Georgetown University Massive Data Institute Green Space Data Challange and won the Physical Environment category part of the challenge—this event then prompted us to come to the conference and interact with other data users.
For a relatively small conference, it was packed with a lot of good information. Topics ranged from platforms for cross-coordination on data projects to evaluation of data tools being used throughout the county to the showcase of data science education being taught in college. We took notes on everything—datasets, frameworks, and even people that IAN could work with on future projects.
For me, a data enthusiast, I loved seeing all the different ways people engage with data and what the key takeaways from the talks were. A lot of the presentations focused on equity, something that we pay attention to in the socio-environemntal sphere. One interesting thing I learned was the process and systemic issues around heirs property, or when property transfers ownership without a clear plan. I’ve looked at housing affordability as an indicator before but I have not considered heirs property before in thinking about various housing issues—especially issues that can negatively impact communities of color. Another theme I took away from the conference was connectivity. How the data user and provider need to communicate and interact in order to better understand where each other is coming from. One of the sessions was simply dedicated to the audience providing use-case feedback directly to a U.S. Census official. The Census, along with other government agencies, wants to understand its users and how the Census can best serve them. Equity, connectivity, and other themes, were all points we internalize and want to continue to work towards at IAN.
This conference was a great place to meet other professionals working with public data. The scope, background, and features from all of these talks have inspired Lili and I to continue our data journeys and our work on socio-environmental indicators. We are always looking for new ways to improve ourselves (e.g., Greenspace data challenge), perhaps we will get the chance to try another challenge or attend another conference soon.
About the author
Joe Edgerton

Joseph Edgerton is an Assistant Science Communicator for the Integration and Application Network (IAN) within the University of Maryland Center for Environmental Science. Joe graduated from Oregon State University with a B.S. in biology in 2019. After undergrad, he became increasingly interested in data visualization and communication. Formally an IAN intern, he continues to assist IAN team members with designing science communication products, engaging stakeholders, and working with data. Joe enjoys travelling to nature parks, working with all things R code, and having “decent” hacky sack skills.