Skip to main content
UMCES HOME
DONATE
Search form
Search
Work with Us
Science communication services
Environmental report card production
Training and capacity building
Stakeholder Engagement
Careers
Media Library
Symbols
Graphics
Photos
Videos
Report cards
Education
Professional Certificate
MEES Graduate Program
Short Courses
Initiatives
Blog
Enewsletter
Publications
Books
Report Cards
Newsletters
Reports
Brochures
Posters
Papers
Projects
About
Who we are
What we do
Our Mission
History
Partnerships
Contact
Land Acknowledgment Statement
Project Videos
Home
Media Library
Search Term
Album
Any
Ecosystems > Coastal/Marine
Ecosystems > Desert
Ecosystems > Elements
Ecosystems > Freshwater
Ecosystems > Grassland
Ecosystems > Maps
Ecosystems > Meteorology/Climate
Ecosystems > Mountains/Tundra
Ecosystems > Other
Fauna > Amphibians
Fauna > Birds
Fauna > Cnidaria
Fauna > Crustaceans
Fauna > Echinoderms
Fauna > Fish
Fauna > Insects/Arachnids
Fauna > Mammals
Fauna > Molluscs
Fauna > Other
Fauna > Protozoans
Fauna > Reptiles
Fauna > Worms
Flora > Fungi/Lichen/Moss
Flora > Grasses/Herbaceous Plants
Flora > Macroalgae
Flora > Mangroves
Flora > Marsh/Wetlands
Flora > Microalgae
Flora > Seagrass/SAV
Flora > Trees/Shrubs/Vines
Human > Agriculture
Human > Aquaculture
Human > Climate Change
Human > Culture/Archaeology
Human > Development/Infrastructure
Human > Education
Human > Environmental Degradation
Human > Fishing
Human > Forestry
Human > Management/Restoration
Human > Manufacturing/Refining
Human > Mapping/Navigation
Human > Mining
Human > Other
Human > Recreation
Human > Science/Research
Human > Services
Human > Transport
Processes > Biological
Processes > Chemical
Processes > Inputs/flows
Processes > Modifiers
Processes > Physical
Prokaryotes and Viruses > Bacteria/cyanobacteria/archaea
Prokaryotes and Viruses > Viruses
Media Type
Any
Symbol
Graphic
Photo
Video
Vector or Raster
Either
Raster
Vector
Sort Order
↓ Date
↓ Num. of Downloads
↓ Name
↑ Date
↑ Num. of Downloads
↑ Name
Apply Filters
Clear Filters
Lightbox (
0
)
Symbol Package
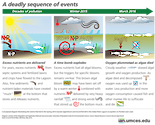
A deadly sequence of events in Florida
Inputs: sediments 2
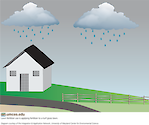
Atmospheric and Eutrophic Acidification
Lawn Fertilizer Limitation as a Key Stewardship…
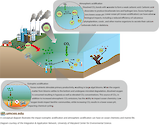
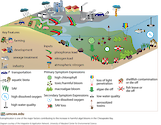
The Causes and Effects of Eutrophication
Stream 3D: healthy
Stream 3D: unhealthy
River 3D: comparison healthy vs eutrophic
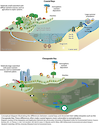
Coastal lagoon vs. river-valley estuary
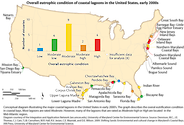
Map of national coastal lagoon conditions
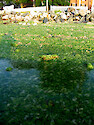
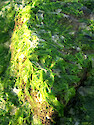
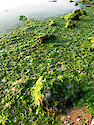
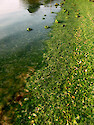
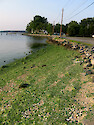
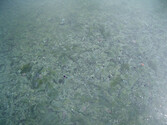
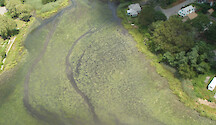
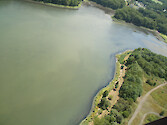
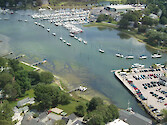
Ulva bloom on the Tred Avon River
Ulva bloom on the Tred Avon River
Ulva bloom on the Tred Avon River
Ulva bloom on the Tred Avon River
Ulva bloom on the Tred Avon River
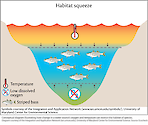
Habitat squeeze
Beggiatoa on Ulva in shallow cove Providence…
Macroalgal bloom in Buttonwoods, Warwick, RI
near anoxic sulfidic waters- Greenwich Cove, RI
Wickford Harbor RI - sulfidic waters
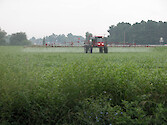
The application of an herbicide on a farm field
Tubastrea spp. 1 (Sun Coral)
Tubastrea spp. 2 (Sun Coral)
Autotrophic system experiment
1
2
Next