Skip to main content
UMCES HOME
DONATE
Search form
Search
Work with Us
Science communication services
Environmental report card production
Training and capacity building
Stakeholder Engagement
Careers
Media Library
Symbols
Graphics
Photos
Videos
Report cards
Education
Professional Certificate
MEES Graduate Program
Short Courses
Initiatives
Blog
Enewsletter
Publications
Books
Report Cards
Newsletters
Reports
Brochures
Posters
Papers
Projects
About
Who we are
What we do
Our Mission
History
Partnerships
Contact
Land Acknowledgment Statement
Project Videos
Home
Media Library
Search Term
Album
Any
Ecosystems > Coastal/Marine
Ecosystems > Desert
Ecosystems > Elements
Ecosystems > Freshwater
Ecosystems > Grassland
Ecosystems > Maps
Ecosystems > Meteorology/Climate
Ecosystems > Mountains/Tundra
Ecosystems > Other
Fauna > Amphibians
Fauna > Birds
Fauna > Cnidaria
Fauna > Crustaceans
Fauna > Echinoderms
Fauna > Fish
Fauna > Insects/Arachnids
Fauna > Mammals
Fauna > Molluscs
Fauna > Other
Fauna > Protozoans
Fauna > Reptiles
Fauna > Worms
Flora > Fungi/Lichen/Moss
Flora > Grasses/Herbaceous Plants
Flora > Macroalgae
Flora > Mangroves
Flora > Marsh/Wetlands
Flora > Microalgae
Flora > Seagrass/SAV
Flora > Trees/Shrubs/Vines
Human > Agriculture
Human > Aquaculture
Human > Climate Change
Human > Culture/Archaeology
Human > Development/Infrastructure
Human > Education
Human > Environmental Degradation
Human > Fishing
Human > Forestry
Human > Management/Restoration
Human > Manufacturing/Refining
Human > Mapping/Navigation
Human > Mining
Human > Other
Human > Recreation
Human > Science/Research
Human > Services
Human > Transport
Processes > Biological
Processes > Chemical
Processes > Inputs/flows
Processes > Modifiers
Processes > Physical
Prokaryotes and Viruses > Bacteria/cyanobacteria/archaea
Prokaryotes and Viruses > Viruses
Media Type
Any
Symbol
Graphic
Photo
Video
Vector or Raster
Either
Raster
Vector
Sort Order
↓ Date
↓ Num. of Downloads
↓ Name
↑ Date
↑ Num. of Downloads
↑ Name
Apply Filters
Clear Filters
Lightbox (
0
)
Symbol Package
American cowboy
Antilocapra americana (Pronghorn deer)
Empidonax traillii extimus (Southwestern Willow…
Juniperus monosperma (One-seed Juniper)
Man tubing
Populus deltoides (Eastern Cottonwood)
Sedona Red Rocks
Orinoco River Basin — A Report Card Collaboration…
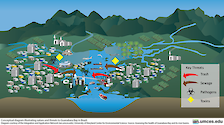
Guanabara Bay Values and Threats
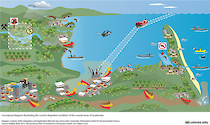
The coastal areas of Guatemala are impacted by…
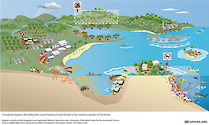
The current features of and threats to the…
Inputs: sewage
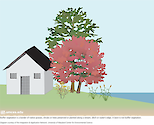
Buffer Vegetation as a Key Stewardship Behavior
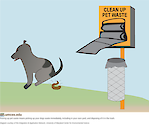
Cleaning Up Pet Waste as a Key Watershed…
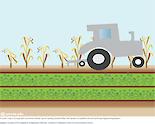
Cover Crops as a Key Watershed Stewardship…
Lawn Fertilizer Limitation as a Key Stewardship…
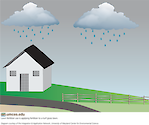
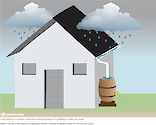
Rain Barrels as a Key Watershed Stewardship…
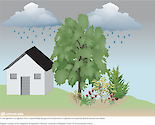
Rain Gardens as a Key Stewardship Behavior
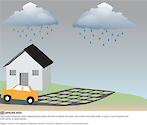
The Reduction of Hard Surfaces as a Key Watershed…
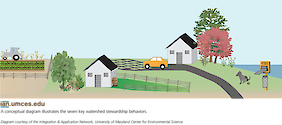
The Seven Key Stewardship Behaviors to Promote…
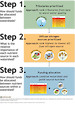
Steps to Identifying High Priority Tributaries
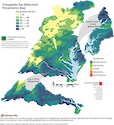
Chesapeake Bay Watershed Percipitation Map 2013
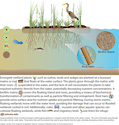
Floating Wetlands Structure and Impact
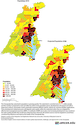
Population Map Chesapeake Bay Watershed
1
2
3
4
5
Next