

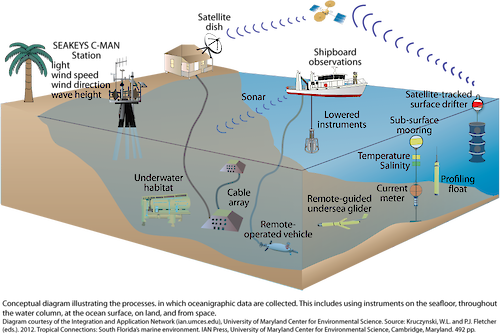
Collecting oceanographic data
Conceptual diagram illustrating the processes in which oceanographic data are collected.
diagram illustration instrument station satellite observation reasearch data sensor salinity| Property | Value |
|---|---|
| Author(s) | Jane Hawkey |
| Author Company | Integration and Application Network |
| Date Created | 2012-01-01 |
| Album | Human > Science/Research |
| Type | Graphic |
| Publication | Tropical Connections: South Florida's marine environment |
| Project(s) | South Florida Ecosystem Synthesis |
| Dimensions | 1000 x 666 |
| Filesize | 247.0 kB |
| Number of Downloads | 525 |
| Filetype(s) | PNG |
| License | Attribution-ShareAlike 4.0 International (CC BY-SA 4.0) |
| Required Attribution | Jane Hawkey, Integration and Application Network (ian.umces.edu/media-library) |