Skip to main content
UMCES HOME
DONATE
Search form
Search
Work with Us
Science communication services
Environmental report card production
Training and capacity building
Stakeholder Engagement
Careers
Media Library
Symbols
Graphics
Photos
Videos
Report cards
Education
Professional Certificate
MEES Graduate Program
Short Courses
Initiatives
Blog
Enewsletter
Publications
Books
Report Cards
Newsletters
Reports
Brochures
Posters
Papers
Projects
About
Who we are
What we do
Our Mission
History
Partnerships
Contact
Land Acknowledgment Statement
Project Videos
Home
Media Library
Search Term
Album
Any
Ecosystems > Coastal/Marine
Ecosystems > Desert
Ecosystems > Elements
Ecosystems > Freshwater
Ecosystems > Grassland
Ecosystems > Maps
Ecosystems > Meteorology/Climate
Ecosystems > Mountains/Tundra
Ecosystems > Other
Fauna > Amphibians
Fauna > Birds
Fauna > Cnidaria
Fauna > Crustaceans
Fauna > Echinoderms
Fauna > Fish
Fauna > Insects/Arachnids
Fauna > Mammals
Fauna > Molluscs
Fauna > Other
Fauna > Protozoans
Fauna > Reptiles
Fauna > Worms
Flora > Fungi/Lichen/Moss
Flora > Grasses/Herbaceous Plants
Flora > Macroalgae
Flora > Mangroves
Flora > Marsh/Wetlands
Flora > Microalgae
Flora > Seagrass/SAV
Flora > Trees/Shrubs/Vines
Human > Agriculture
Human > Aquaculture
Human > Climate Change
Human > Culture/Archaeology
Human > Development/Infrastructure
Human > Education
Human > Environmental Degradation
Human > Fishing
Human > Forestry
Human > Management/Restoration
Human > Manufacturing/Refining
Human > Mapping/Navigation
Human > Mining
Human > Other
Human > Recreation
Human > Science/Research
Human > Services
Human > Transport
Processes > Biological
Processes > Chemical
Processes > Inputs/flows
Processes > Modifiers
Processes > Physical
Prokaryotes and Viruses > Bacteria/cyanobacteria/archaea
Prokaryotes and Viruses > Viruses
Media Type
Any
Symbol
Graphic
Photo
Video
Vector or Raster
Either
Raster
Vector
Sort Order
↓ Date
↓ Num. of Downloads
↓ Name
↑ Date
↑ Num. of Downloads
↑ Name
Apply Filters
Clear Filters
Lightbox (
0
)
Symbol Package
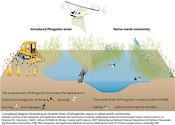
Native vs invasive Phragmites
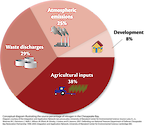
Nitrogen input in the Chesapeake Bay
Phosphorus in the Chesapeake Bay
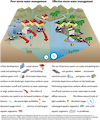
Poor vs effective storm management
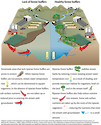
Riparian forest buffers
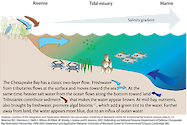
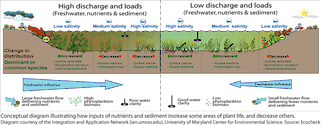
Sediment influence and water clarity
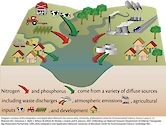
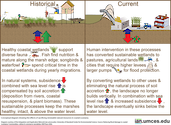
Sources of nitrogen/phosphorus deposition
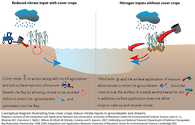
Winter cover crops reduce nitrates
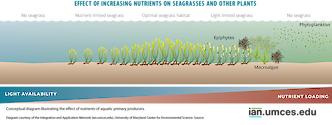
Effect of nutrients of aquatic primary producers
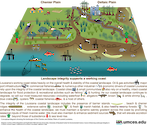
Diagram showing the landscape of the Chenier and…
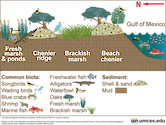
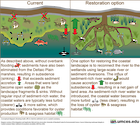
Diagram showing ecosystems of the Chenier Plain…
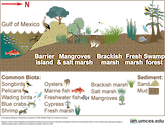
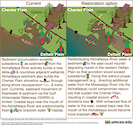
Diagram showing ecosystems of the Deltaic Plain…
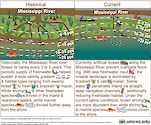
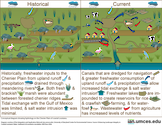
Diagram showing hydrology of the Deltaic Plain of…
Diagram showing hydrology on the Chenier Plain of…
Diagram showing trade-offs in Deltaic and Chenier…
Diagram showing trade-offs in riverine sediment…
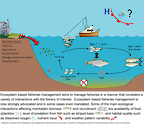
Ecosystem based fisheries management
Diagram showing features of and threats to…
Diagram showing impacts of storm surge on coastal…
Diagram showing issues around flood protection in…
Diagram showing issues around storm protection in…
Diagram showing the effects of sacrificing…
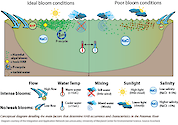
Environmental conditions that lead to harmful…
Environmental factors that control aquatic grass…
Prev
1
…
9
10
11
12
13
14
15
16
17
18
Next