

Local Sea Level Trends
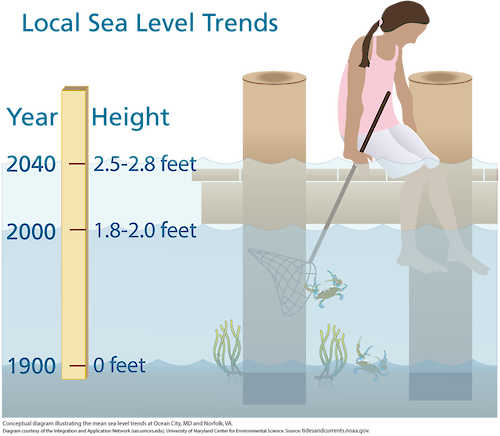
Conceptual diagram illustrating the mean sea level trends at Ocean City, MD and Norfolk, VA. Source: tidesandcurrents.noaa.gov
diagram climate change global warming sea level rise flooding trends| Property | Value |
|---|---|
| Author(s) | Jane Hawkey |
| Author Company | Integration and Application Network |
| Date Created | 2012-08-01 |
| Album | Human > Climate Change |
| Type | Graphic |
| Dimensions | 1000 x 871 |
| Filesize | 123.0 kB |
| Number of Downloads | 387 |
| Filetype(s) | PNG |
| License | Attribution-ShareAlike 4.0 International (CC BY-SA 4.0) |
| Required Attribution | Jane Hawkey, Integration and Application Network (ian.umces.edu/media-library) |