Join the Celebration!
Learn More
Celebrating 100 Years of Science! | 1925-2025
Join the Celebration!
UMCES HOME
DONATE
Search form
Search
Work with Us
Science communication services
Environmental report card production
Training and capacity building
Stakeholder Engagement
Careers
Media Library
Symbols
Graphics
Photos
Videos
Report cards
Education
Professional Certificate
MEES Graduate Program
Short Courses
Initiatives
Blog
Enewsletter
Publications
Books
Report Cards
Newsletters
Reports
Brochures
Posters
Papers
Projects
About
Who we are
What we do
Our Mission
History
Partnerships
Contact
Land Acknowledgment Statement
Project Videos
Home
Media Library
Search Term
Album
Any
Ecosystems > Coastal/Marine
Ecosystems > Desert
Ecosystems > Elements
Ecosystems > Freshwater
Ecosystems > Grassland
Ecosystems > Maps
Ecosystems > Meteorology/Climate
Ecosystems > Mountains/Tundra
Ecosystems > Other
Fauna > Amphibians
Fauna > Birds
Fauna > Cnidaria
Fauna > Crustaceans
Fauna > Echinoderms
Fauna > Fish
Fauna > Insects/Arachnids
Fauna > Mammals
Fauna > Molluscs
Fauna > Other
Fauna > Protozoans
Fauna > Reptiles
Fauna > Worms
Flora > Fungi/Lichen/Moss
Flora > Grasses/Herbaceous Plants
Flora > Macroalgae
Flora > Mangroves
Flora > Marsh/Wetlands
Flora > Microalgae
Flora > Seagrass/SAV
Flora > Trees/Shrubs/Vines
Human > Agriculture
Human > Aquaculture
Human > Climate Change
Human > Culture/Archaeology
Human > Development/Infrastructure
Human > Education
Human > Environmental Degradation
Human > Fishing
Human > Forestry
Human > Management/Restoration
Human > Manufacturing/Refining
Human > Mapping/Navigation
Human > Mining
Human > Other
Human > Recreation
Human > Science/Research
Human > Services
Human > Transport
Processes > Biological
Processes > Chemical
Processes > Inputs/flows
Processes > Modifiers
Processes > Physical
Prokaryotes and Viruses > Bacteria/cyanobacteria/archaea
Prokaryotes and Viruses > Viruses
Media Type
Any
Symbol
Graphic
Photo
Video
Vector or Raster
Either
Raster
Vector
Sort Order
↓ Date
↓ Num. of Downloads
↓ Name
↑ Date
↑ Num. of Downloads
↑ Name
Apply Filters
Clear Filters
Lightbox (
0
)
Symbol Package
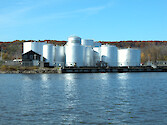
Waterfront fuel depot near Kingston on the Hudson…
Corrugated culvert pipe
Gadus morhua (Atlantic Cod)
Didinium gargantua (Ciliate)
Alosa pseudoharengus (Alewife)
Monarda spp. (Bee Balm)
Monarda spp. (Bee Balm) flowers
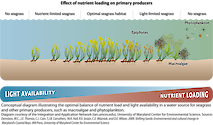
Effect of nutrient loading on primary producers
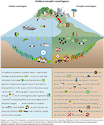
Healthy & eutrophic coastal lagoons
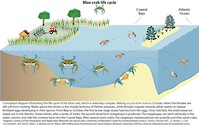
Life cycle of the blue crab
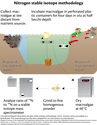
Nitrogen stable isotope methodology
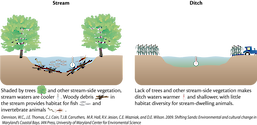
Stream habitat vs. ditch habitat
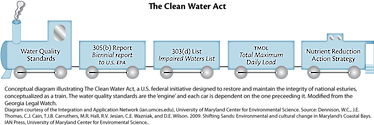
The clean water act
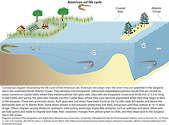
The life cycle of the american eel
Wastewater treatment
Acinetobacter spp. (Bacteria)
Alliaria petiolata (Garlic Mustard)
Betula spp. (Birch)
Center pivot irrigation
Cyanide fishing boat
Cyanide fishing: squeeze bottle
Dynamite fishing: explosion
Dynamite fishing: Molotov cocktail
Fish aggregating device
Prev
1
…
7
8
9
10
11
12
13
14
15
16
…
30
Next