Join the Celebration!
Learn More
Celebrating 100 Years of Science! | 1925-2025
Join the Celebration!
UMCES HOME
DONATE
Search form
Search
Work with Us
Science communication services
Environmental report card production
Training and capacity building
Stakeholder Engagement
Careers
Media Library
Symbols
Graphics
Photos
Videos
Report cards
Education
Professional Certificate
MEES Graduate Program
Short Courses
Initiatives
Blog
Enewsletter
Publications
Books
Report Cards
Newsletters
Reports
Brochures
Posters
Papers
Projects
About
Who we are
What we do
Our Mission
History
Partnerships
Contact
Land Acknowledgment Statement
Project Videos
Home
Media Library
Search Term
Album
Any
Ecosystems > Coastal/Marine
Ecosystems > Desert
Ecosystems > Elements
Ecosystems > Freshwater
Ecosystems > Grassland
Ecosystems > Maps
Ecosystems > Meteorology/Climate
Ecosystems > Mountains/Tundra
Ecosystems > Other
Fauna > Amphibians
Fauna > Birds
Fauna > Cnidaria
Fauna > Crustaceans
Fauna > Echinoderms
Fauna > Fish
Fauna > Insects/Arachnids
Fauna > Mammals
Fauna > Molluscs
Fauna > Other
Fauna > Protozoans
Fauna > Reptiles
Fauna > Worms
Flora > Fungi/Lichen/Moss
Flora > Grasses/Herbaceous Plants
Flora > Macroalgae
Flora > Mangroves
Flora > Marsh/Wetlands
Flora > Microalgae
Flora > Seagrass/SAV
Flora > Trees/Shrubs/Vines
Human > Agriculture
Human > Aquaculture
Human > Climate Change
Human > Culture/Archaeology
Human > Development/Infrastructure
Human > Education
Human > Environmental Degradation
Human > Fishing
Human > Forestry
Human > Management/Restoration
Human > Manufacturing/Refining
Human > Mapping/Navigation
Human > Mining
Human > Other
Human > Recreation
Human > Science/Research
Human > Services
Human > Transport
Processes > Biological
Processes > Chemical
Processes > Inputs/flows
Processes > Modifiers
Processes > Physical
Prokaryotes and Viruses > Bacteria/cyanobacteria/archaea
Prokaryotes and Viruses > Viruses
Media Type
Any
Symbol
Graphic
Photo
Video
Vector or Raster
Either
Raster
Vector
Sort Order
↓ Date
↓ Num. of Downloads
↓ Name
↑ Date
↑ Num. of Downloads
↑ Name
Apply Filters
Clear Filters
Lightbox (
0
)
Symbol Package
Syringodium filiforme
Thalassia testudinum (Turtlegrass)
Chelone glabra (White Turtlehead)
Lobelia cardinalis (Cardinal Flower)
Monarda spp. (Bee Balm)
Monarda spp. (Bee Balm) flowers
Osmunda cinnamomea (Cinnamon Fern)
Pennisetum ciliare (Buffelgrass)
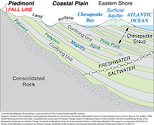
Coastal plain aquifer system
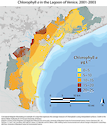
Dissolved chlorophyll in the Lagoon of Venice
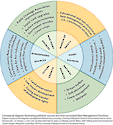
Managing pollution
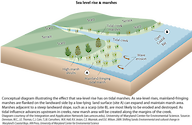
Sea-level rise & marshes
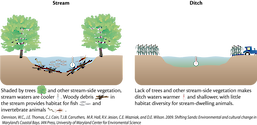
Stream habitat vs. ditch habitat
The 'Brunn rule'
Acer platanoides (Norway Maple)
Acinetobacter spp. (Bacteria)
Agropyron pectiniforme (Crested Wheatgrass)
Alliaria petiolata (Garlic Mustard)
Aratus pisonii (Mangrove Tree Crab)
Berberis thunbergii (Japanese Barberry)
Betula spp. (Birch)
Bouteloua dactyloides (Buffalo Grass)
Bouteloua gracilis (Blue Grama)
Callinectes sapidus (Blue Crab) : eggs
Prev
1
…
8
9
10
11
12
13
14
15
16
17
…
32
Next