Join the Celebration!
Learn More
Celebrating 100 Years of Science! | 1925-2025
Join the Celebration!
UMCES HOME
DONATE
Search form
Search
Work with Us
Science communication services
Environmental report card production
Training and capacity building
Stakeholder Engagement
Careers
Media Library
Symbols
Graphics
Photos
Videos
Report cards
Education
Professional Certificate
MEES Graduate Program
Short Courses
Initiatives
Blog
Enewsletter
Publications
Books
Report Cards
Newsletters
Reports
Brochures
Posters
Papers
Projects
About
Who we are
What we do
Our Mission
History
Partnerships
Contact
Land Acknowledgment Statement
Project Videos
Home
Media Library
Search Term
Album
Any
Ecosystems > Coastal/Marine
Ecosystems > Desert
Ecosystems > Elements
Ecosystems > Freshwater
Ecosystems > Grassland
Ecosystems > Maps
Ecosystems > Meteorology/Climate
Ecosystems > Mountains/Tundra
Ecosystems > Other
Fauna > Amphibians
Fauna > Birds
Fauna > Cnidaria
Fauna > Crustaceans
Fauna > Echinoderms
Fauna > Fish
Fauna > Insects/Arachnids
Fauna > Mammals
Fauna > Molluscs
Fauna > Other
Fauna > Protozoans
Fauna > Reptiles
Fauna > Worms
Flora > Fungi/Lichen/Moss
Flora > Grasses/Herbaceous Plants
Flora > Macroalgae
Flora > Mangroves
Flora > Marsh/Wetlands
Flora > Microalgae
Flora > Seagrass/SAV
Flora > Trees/Shrubs/Vines
Human > Agriculture
Human > Aquaculture
Human > Climate Change
Human > Culture/Archaeology
Human > Development/Infrastructure
Human > Education
Human > Environmental Degradation
Human > Fishing
Human > Forestry
Human > Management/Restoration
Human > Manufacturing/Refining
Human > Mapping/Navigation
Human > Mining
Human > Other
Human > Recreation
Human > Science/Research
Human > Services
Human > Transport
Processes > Biological
Processes > Chemical
Processes > Inputs/flows
Processes > Modifiers
Processes > Physical
Prokaryotes and Viruses > Bacteria/cyanobacteria/archaea
Prokaryotes and Viruses > Viruses
Media Type
Any
Symbol
Graphic
Photo
Video
Vector or Raster
Either
Raster
Vector
Sort Order
↓ Date
↓ Num. of Downloads
↓ Name
↑ Date
↑ Num. of Downloads
↑ Name
Apply Filters
Clear Filters
Lightbox (
0
)
Symbol Package
Cyanide fishing boat
Cyanide fishing: squeeze bottle
Dynamite fishing: explosion
Dynamite fishing: Molotov cocktail
Ghost net
Landfill
Old bottle
Old tires
Plastic bag 1
Plastic bottle 3
Roadside trash
Rusty drum
Soda can
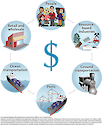
Climate impacts on human health
How sea-level rise affects the community
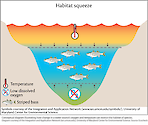
Habitat squeeze
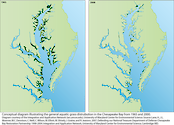
Chesapeake Bay aquatic grass distribution from…
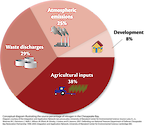
Nitrogen input in the Chesapeake Bay
Phosphorus in the Chesapeake Bay
Unofficial boat ramp and degraded shoreline
Air quality: high
Air quality: low
Air quality: medium
Acid rain
Prev
1
2
3
Next