Skip to main content
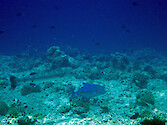
Barracuda in Palau
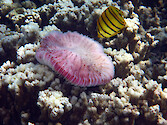
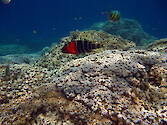
Butterflyfish eating a mushroom coral, Palau
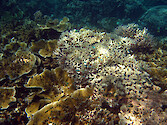
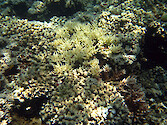
Coral bleaching in Palau
Coral bleaching in Palau
Coral bleaching in Palau
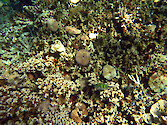
Corals in Palau
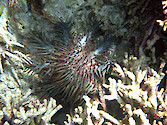
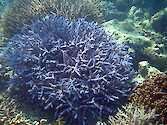
Crown of thorns starfish in Palau
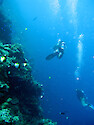
Diving the Blue Corner, Palau
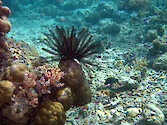
Feather star on coral at one of the sites…
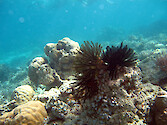
Feather stars on coral at one of the sites…
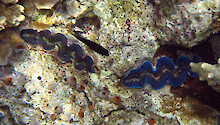
Giant clams in Palau
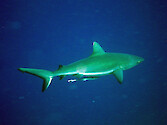
Grey reef shark, Palau
Harlequin tuskfish in Palau
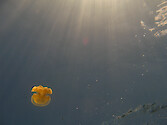
Jellyfish Lake, Palau
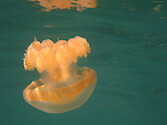
Jellyfish Lake, Palau
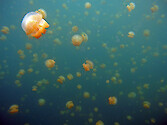
Jellyfish Lake, Palau
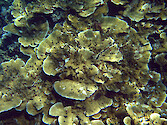
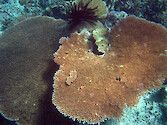
Plate coral at the Cemetery, Palau
Plate coral in Palau
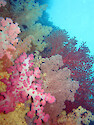
Soft coral, Palau
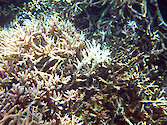
Staghorn coral in Palau
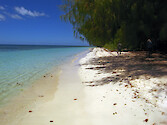
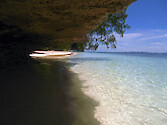
Ulong Island, Palau
Ulong Island, Palau
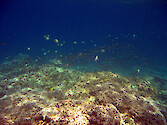
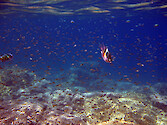
Underwater in Palau
Underwater in Palau