

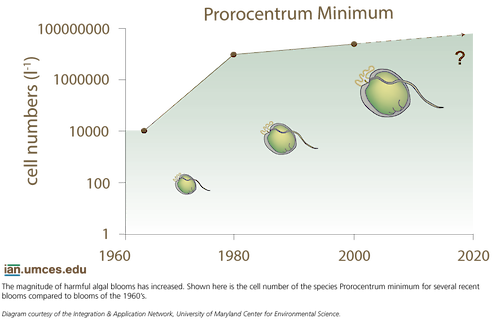
Prorocentrum Minimum Levels since 1970
A graph depicts the trend of increasing prorocentrum minimum levels since 1970 in the Chesapeake Bay.
diagram algea graph blooms harmful magnitude trends chesapeake bay increasing prorocentrum minimum| Property | Value |
|---|---|
| Author(s) | Jane Hawkey |
| Author Company | Integration and Application Network |
| Date Created | 2014-07-08 |
| Album | Ecosystems > Coastal/Marine |
| Type | Graphic |
| Dimensions | 886 x 566 |
| Filesize | 54.5 kB |
| Number of Downloads | 333 |
| Filetype(s) | PNG |
| License | Attribution-ShareAlike 4.0 International (CC BY-SA 4.0) |
| Required Attribution | Jane Hawkey, Integration and Application Network (ian.umces.edu/media-library) |