

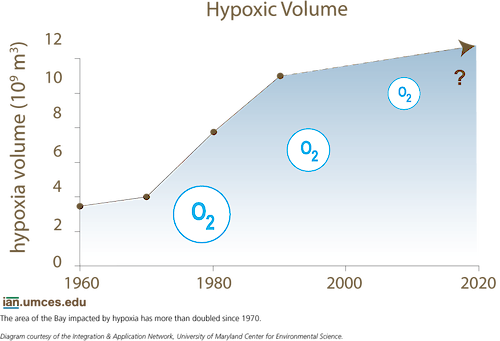
Trends in Hypoxic Volume Since 1970
A graph depicts the increasingly high levels of hypoxia in the Chesapeake Bay since 1970.
diagram hypoxia oxygen levels low graph trends 1970 chesapeake bay hypoxic volume| Property | Value |
|---|---|
| Author(s) | Jane Hawkey |
| Author Company | Integration and Application Network |
| Date Created | 2014-07-08 |
| Album | Ecosystems > Coastal/Marine |
| Type | Graphic |
| Dimensions | 876 x 597 |
| Filesize | 39.6 kB |
| Number of Downloads | 349 |
| Filetype(s) | PNG |
| License | Attribution-ShareAlike 4.0 International (CC BY-SA 4.0) |
| Required Attribution | Jane Hawkey, Integration and Application Network (ian.umces.edu/media-library) |