Assembling Indicators for a Mississippi River Basin Report Card
Bill Nuttle · | Environmental Report Cards |The report card for the Mississippi River basin. The purpose of this report card is to provide people with information on status and trends of the entire Mississippi basin taken as a whole. The watershed of the Mississippi covers 40 percent of the continental United States. Exploration and development of the region during the 19th and the first half of the 20th centuries helped define the character of the United States. As well, the mystery inspired by the river and wonder at the vast natural resources in its basin enrich our culture. This project has a broader focus compared with other environmental report cards we have done.

Activities in the basin serve as an engine of today’s national economy. The Mississippi basin constitutes a vast machine powered by the hydrologic cycle; runoff from the western flank of the Appalachians and the eastern slope of the Rockies flows through it into the Gulf of Mexico. People tap into this continually renewed flow for a supply of water, for recreation, to generate power, and to grow crops - that are then transported down the Mississippi to the Gulf and on to the rest of the world. At its mouth, the flow of the Mississippi River sustains a coastal landscape and feeds productive fisheries. More and more, the problems facing managers occur at the scale of the entire basin. Climate change alters the hydrologic cycle that powers the basin, and human activities throughout the basin affect nutrients carried by rivers resulting in low oxygen conditions that threaten fisheries in the Gulf of Mexico.
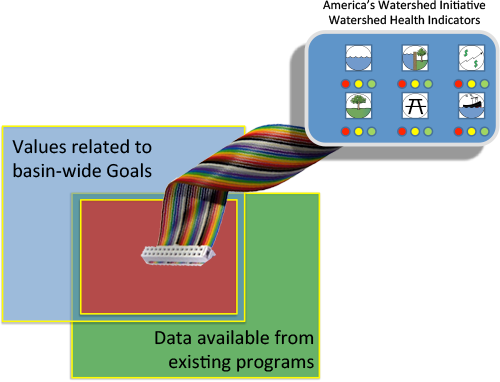
The new report card is part of the effort by America’s Watershed Initiative, to create an integrated approach to management across the entire Mississippi River Basin. At a meeting last year, stakeholders in the region defined six goals related to critical functions provided by the river basin. The key challenge in developing the report card is to assemble a set of indicators related to these goals.

An indicator is a signal that relays a complex message in a simplified and useful manner. Think of the indicator lights found on the dashboard of a car. Normally unseen, they light up if the oil pressure is too low, the engine temperature too high, or the gas tank is nearly empty. The indicators signal only that a problem exists in a critical function of the car, but they provide little or no information about the cause of the problem or what to do about it. A mechanic has access to more detailed diagnostic information from the car’s electronic controls through a plug under the dash. The role of the indicator light is to get you to take your car to a mechanic when a problem occurs. The indicators being developed for the Mississippi basin report card are intended to play a similar role.
The challenge is that a lot of information is already being collected in the Mississippi basin. This project builds on existing data collected in connection with various management activities already active in the basin, many of which have a long history. For example, the Mississippi River Commission was established in 1879 to manage flood control and navigation in the entire basin. Since 1948, ORSANCO has coordinated efforts of eight states to maintain water quality in the heavily industrialized Ohio River sub-basin. A multitude of other agencies operate at the state and local levels. Much of the information already being collected is too detailed to use directly, that is it is comparable to the diagnostic data that your mechanic would tap into.

Over the next 18 months we will be conducting a series of workshops in different parts of the Mississippi basin. Each workshop will bring together experts who are knowledgeable about the functioning of the river basin in a particular geographic area. The goal is to identify data that can be used in the basin-wide indicators. Two overarching criteria guide the selection of indicators. First, the indicator must address values or concerns that people have in connection with one of the six basin-wide goals. Second, the indicator must rely on existing data that are readily available. Secondary criteria that will guide final selection and scoring of the indicators include:
- Integrative – does the indicator integrate information over time and over a large region?
- Transparent and understandable – is the indicator easy to understand or explain to a general audience?
- Spatially explicit – can the indicator be mapped or interpolated spatially?
The final set of indicators will not capture every aspect of the river basin, nor should it. Mark Twain writes in “Life on the Mississippi” of his regret at having acquired too much knowledge as a riverboat pilot. “No, the romance and the beauty were all gone from the river. All the value any feature of it had for me now was the amount of usefulness it could furnish toward compassing the safe piloting of a steamboat.” Rest assured that the basin-wide report card will not include an indicator for the romance and beauty of the Mississippi River. People will have to find that on their own.