

Bridging Science and Community: The 2025 Chesapeake Bay Report Card
Julia Frangenberg · | Science Communication | 2 commentsThe Chesapeake Bay and its watershed are more than beautiful landscapes. They are the backbone of local economies, habitat for rare and fascinating species, and the home of complex systems between humans, wildlife, and policy.
Intensifying climate change and urban development increase stressors negatively impacting this rich ecosystem and the people who rely on it. In 1998, the Chesapeake Bay Foundation (CBF) produced its first annual “State of the Bay” report card. This document detailed the overall health of the bay through a set of 13 comprehensive environmental indicators 1. The report measured the Bay’s health in comparison to the first written accounts described by Captain John Smith in the early 1600s.
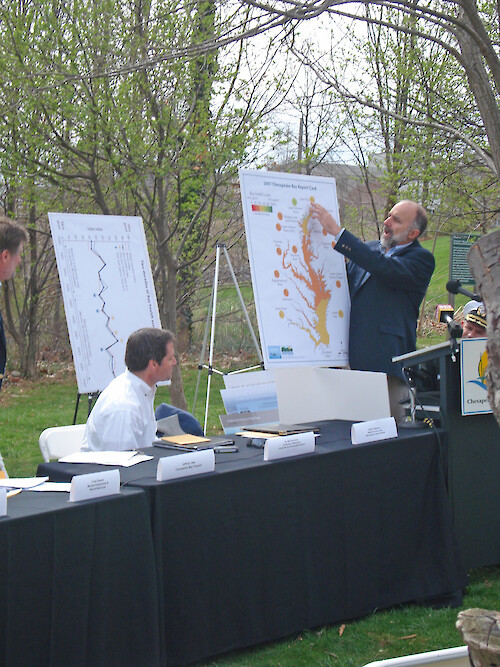
In 2007, the Integration and Application Network (IAN) 2, a research group within the University of Maryland Center for Environmental Science (UMCES), released its first Chesapeake Bay Health report card. Rather than rating it against historical records, IAN used environmental thresholds for water quality and habitat health to assign a grade to the Bay. Today, this annual document is known as the Chesapeake Bay and Watershed (CBW) Report Card and helps to communicate changes in the Bay’s health using diverse indicators.
IAN-UMCES and partners have created report cards for ecosystems around the country and the globe. 2015 marked the first use of socioeconomic indicators like income, recreation, and transportation in a report card for the Mississippi River.3 This proved to be a catalyst for action, providing holistic metrics that policymakers could use to set restoration goals. Science communication, or the practice of sharing scientific information beyond just a scientific audience, is crucial in assuring that these findings inspire actionable change.4
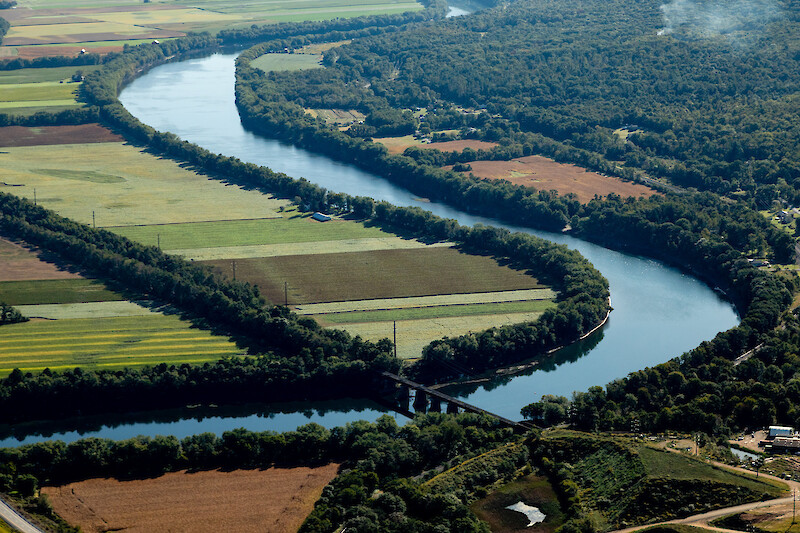
This year’s 2025 CBW report card earned a “C” grade (50%). A slight decline from last year’s “C+” (55%), this grade change is largely due to record-breaking heat and intense storms. This resulted in increased debris, fertilizer, and dirt entering our waterways.5 The report card also evaluates the health of the Bay’s watershed, the broader region where precipitation collects and flows into creeks and rivers, then ultimately reaches the Bay.6 This year’s Chesapeake Bay and Watershed report card, which incorporates ecological, social, and economic indicators, scored a “C+” grade (57%).5 Despite the year-to-year differences in scores, the long-term health of the Bay has a positive trend and has improved significantly in the last few decades.
Maryland State Senator Sarah Love reflected on this perspective shift at the 2025 CBW Report Card release event, saying, “I remember a ‘D’ grade for the Bay”.7 Her words underscore how far the region has come and the role that unified management plays in inspiring action. She added, “There are ways to… reach that balance point of low impact on our watersheds while ensuring that there’s economic value and gain for everyone.” Senator Love’s thoughts emphasize key values of report cards: that environmental health and economic vitality are interconnected goals.
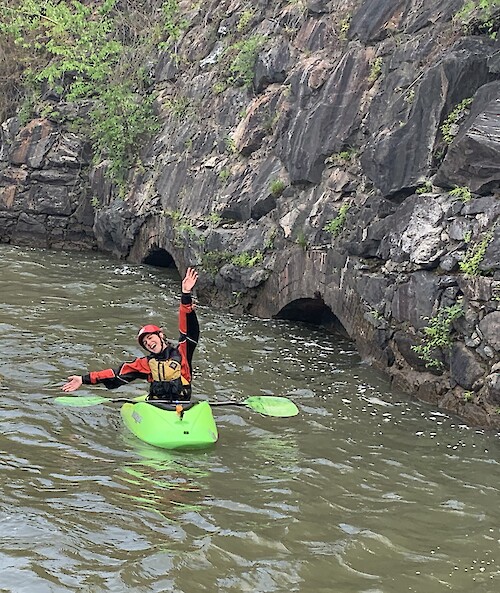
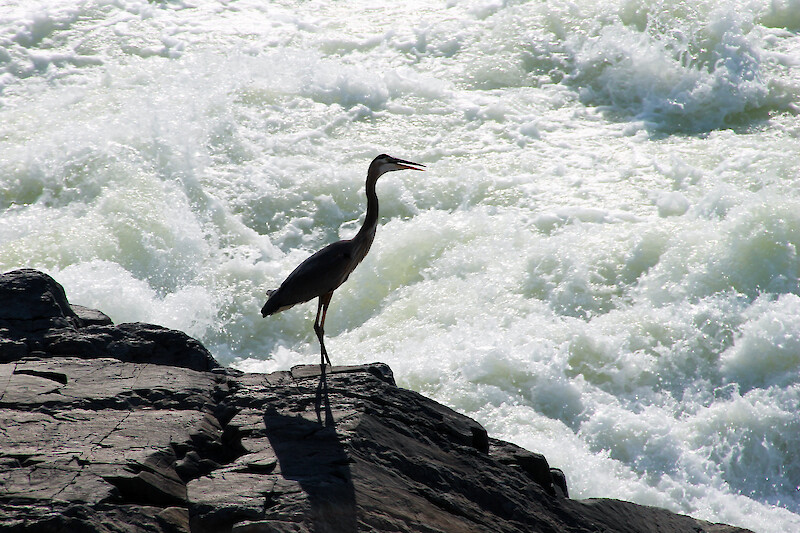
In order to join those two goals, effective science communication is key. Growing up kayaking on the Potomac River, I felt deeply connected to the Bay’s ecosystem because of how closely I could interact with its diverse ecosystem. My family and I often saw great blue herons and beavers during days out on the water. Not only was the river a chance to explore exciting rapids, but it was also a chance to become part of a new ecosystem. As I began studying environmental science and technology at the University of Maryland this past fall, I realized the value of translating scientific knowledge for different audiences. By making data into engaging stories, people from all backgrounds can learn about and care for ecosystems they didn’t feel connected to before.
Report cards and other science communications are windows into understanding how our environment is connected. Products like these have become essential to joining conversations between researchers and other stakeholders. UMCES has embraced this process by connecting with stakeholders from around the world to discuss the goals of annual report cards. In addition to the Chesapeake Bay, IAN-UMCES has partnered with organizations like the World Wildlife Fund to evaluate the health of watersheds like Lake Eerie, Colombia’s Orinoco River, and the Rio Grande.8
In April of 2025, they co-hosted a workshop with the Chesapeake Bay Foundation (CBF). This event brought environmental professionals together to discuss the alignment of watershed report cards with their work. These collaborative events are hosted to help create a report card that reflects both environmental and community health.9
The 2025 CBW Report Card represents more than a score. It represents the ability science holds to inform and unite people of all backgrounds, calling them to action in rebuilding a stronger Bay. By making science accessible, Chesapeake Bay’s researchers can continue to inform our communities on how to adapt to changes and inspire hope for a healthy future, both for locals and wildlife.
References:
- Chesapeake Bay Foundation. (n.d.). About the State of the Bay report. In State of the Bay Report. Retrieved June 24, 2025, from https://www.cbf.org/about-the-bay/state-of-the-bay-report/about-the-state-of-the-bay-report.html
- Integration and Application Network. (2008). 2007 Chesapeake Bay report card. University of Maryland Center for Environmental Science. https://ian.umces.edu/enewsletter/2008/april/2007-chesapeake-bay-report-card/
- Vargas-Nguyen, V., Kelsey, R. H., Jordahl, H., Nuttle, W., Somerville, C., Thomas, J., & Dennison, W. C. (2020). Using Socioenvironmental Report Cards as a Tool for Transdisciplinary Collaboration. Integrated environmental assessment and management, 16(4), 494–507. https://doi.org/10.1002/ieam.4243
- Science Europe. (n.d.). Science Communication. https://scienceeurope.org/our-priorities/science-communication/
- Foo, A., Keitzer, C., Badri, S. L., Kelsey, H., Vargas-Nguyen, V., Fries, A. (2025). Chesapeake Bay and Watershed Report Card 2025. Integration and Application Network - University of Maryland Center for Environmental Science. https://ian.umces.edu/site/assets/files/32674/2025-chesapeake-bay-watershed-report-card.pdf
- NOAA. (n.d.). What is a watershed? National Ocean Service Website. https://oceanservice.noaa.gov/facts/watershed.html
- Love, S. (2025). 2025 Chesapeake Bay and Watershed Report Card Release. University of Maryland Center for Environmental Science, Annapolis, Maryland. https://ian.umces.edu/publications/2025-chesapeake-bay-watershed-report-card/
- EcoHealth Report Cards. (n.d.). Report cards. Integration and Application Network, University of Maryland Center for Environmental Science. https://ecoreportcard.org/report-cards/
- Badri, S. L. and Vargas-Nguyen, V. (2025) Shaping the next generation of Chesapeake Bay report cards. Integration and Application Network - University of Maryland Center for Environmental Science. Newsletter. https://ian.umces.edu/publications/shaping-the-next-generation-of-chesapeake-bay-report-cards/
About the author
Julia Frangenberg

Hi! My name is Julia Frangenberg, and I am a junior at UMD majoring in Environmental Science and Technology with a concentration in Ecological Technology Design and a minor in economics. I’m excited to work with UMCES researching the role of striped bass in the Chesapeake Bay ecosystem as well as working on the COAST card initiative for the Baltimore watershed. Outside of research, I love kayaking, climbing, and spending time outdoors. I’m looking forward to a great summer with UMCES!
Next Post > Climbing Down the Ivory Tower
Comments
-
Adriana Schulman 9 months ago
Hey Julia, great blog! You framed the value and provided an overview of the 2025 Chesapeake Bay and Watershed Report Card well. I also enjoyed reading about your personal connection to the Potomac River. It is so important to effectively communicate scientific data as proper communication can help inform or shift how people interact with their ecosystem.
-
Connor Olsen 9 months ago
Hey Julia, I love your blog. Your description of the Report Card and it's importance is very well portrayed. I also enjoyed the section that mentions Senator Love. Before the Report Card release, I had no idea that there were many government officials who advocated for this. Finally, I enjoyed the final paragraph because it emphasizes the importance of this Report Card as a communication tool.