

Conceptual diagrams: Tips and Tricks for Thought
Maddie Farmer ·In our class this week, we used Adobe Illustrator to make conceptual diagrams of our hand-drawn drafts. It was amazing to see our 2D sketched diagrams come to life with beautiful symbols, juxtaposed sections, pops of color, and much more! The conceptual diagrams or "thought drawings" are a blend of science and art, which is more digestible to the reader.
The IAN Symbol library has a plethora of symbols that can be uploaded into Adobe Illustrator to create these conceptual diagrams.
Here are three main tips and tricks for thought to help improve your conceptual diagrams! IAN provides additional information on creating your own Conceptual Diagram as well.
Keep it Simple
The most important goal of a conceptual diagram is to get your message across to your audience. The fewer the symbols the simpler the design the easier it is for your audience to understand the diagram. Similarity, symbols should stay consistent throughout the diagram to prevent confusion. Information is also easier to understand if there is consistency in font, color, symbol shapes etc.
Colors and Fonts are Key
Colors provide ques to the reader that help shape the conceptual diagram story. For instance, green vs. red text indicates good vs. bad. There can also be a strong juxtaposition among colors or a softer gradient that matches contours or lines within the diagram. Symbols from IAN can also be broken down so that they become less complex. The fonts should also be consistent if the content is related, while the type of font depends on your audience.
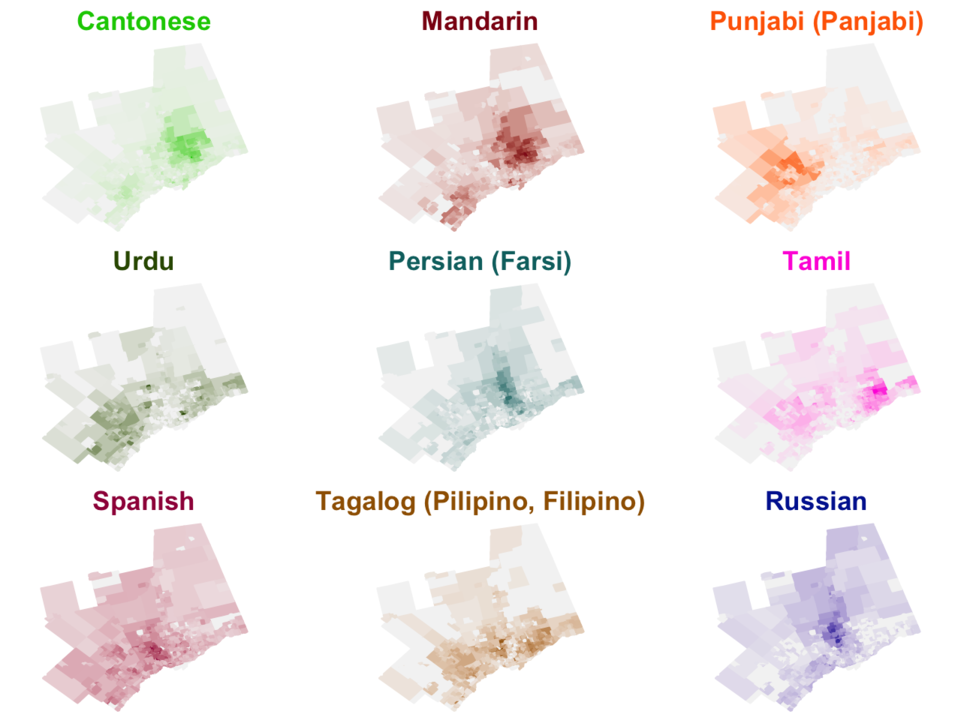
Comparisons and Small Multiples
Edward Tufte defined small multiples as:
"Illustrations of postage-stamp size are indexed by category or a label, sequenced over time like the frames of a movie, or ordered by a quantitative variable not used in the single image itself."
One way to convey information is to create a comparison between two or more components. For instance, i.e. good vs. bad water quality in a river. There can also be comparisons among identical shapes as in small multiples - any differences within the shapes will make comparisons easier. Small multiples can be made in R too!
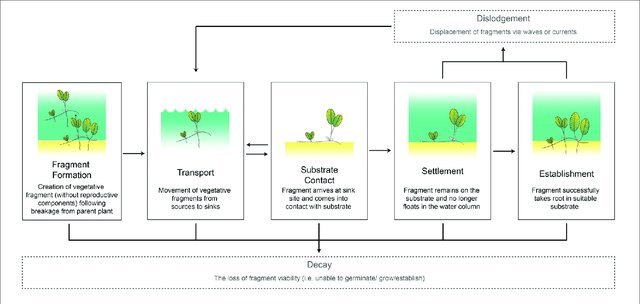
Let's check out a conceptual diagram from an expert:

- Keep it Simple
This diagram only uses the most relevant symbols needed to portray a message. The symbols are consistent throughout the conceptual diagram i.e. the chlorophyll a symbol does not change color. - Colors and Fonts are Key
There is a clear color distinction between the healthy and eutrophic section as shown with the blue and green water. The red X's also signify a decrease and a negative outcome. The font in the title and caption is consistent throughout the conceptual diagram as well. - Comparisons and Small Multiples
There is a clear juxtaposition between the healthy and eutrophic ecosystem - the images are mirror images of each other, so the information is consistent, and the reader only needs to look at the differences between the two ecosystems.There are also clear distinctions in sizes which suggests an increase e.g. the nitrogen and phosphorous increase in the eutrophic system.
How can you improve your conceptual diagram? Should it be simpler? More consistent? Portrayed in small multiples? Comment on your favorite tips and tricks that have helped you!
About the author
This blog was produced by students in the Science Visualization course, offered by the Integration and Application Network through the Marine, Estuarine, Environmental Sciences (MEES) Graduate Program at the University System of Maryland. Bill Dennison and a team of IAN Science Communicators are teaching the course as a 'flipped' classroom so that class time is spent on hands-on training and discussions and feedback on student projects.