

EJSCREEN: What’s in Your Toolbox?
Taylor Gedeon · | MEES 718 Spring 2021 | 17 comments
What is environmental justice (EJ)? I won’t attempt to define the term myself, so instead I’ll provide a succinct explanation by Dr. Dorceta Taylor, an award-winning EJ scholar. “Environmental justice is really concerned with documenting and understanding the disproportionate and unequal burdens that certain communities face.”EJ academics and activists aim to investigate and remediate these environmental burdens that have persisted for decades, and have continued to cause harm to “low-income, Black, Indigenous, Latinx, and Asian people.”
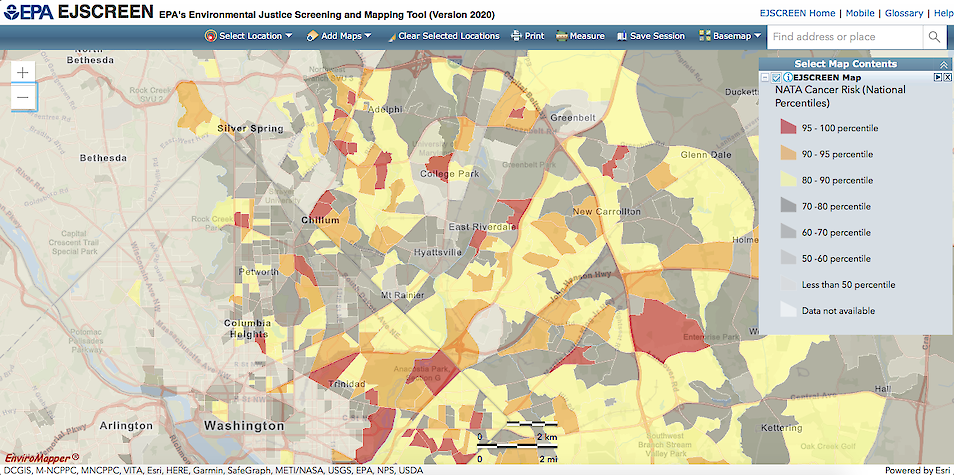
Yet, if EJ movements are to be successful in understanding these burdens, and pursuing remediation, they must first be able to identify and investigate location-specific environmental inequalities. Beginning in 2010, the United States Environmental Protection Agency (EPA) attempted to create a tool to help address this need with the introduction of EJSCREEN. But what exactly is EJSCREEN, and how can it be used? The EPA’s website provides the following description:
“EJSCREEN is an environmental justice mapping and screening tool that provides EPA with a nationally consistent dataset and approach for combining environmental and demographic indicators. EJSCREEN users choose a geographic area; the tool then provides demographic and environmental information for that area. All of the EJSCREEN indicators are publicly-available data. EJSCREEN simply provides a way to display this information and includes a method for combining environmental and demographic indicators into EJ indexes.”
The 11 environmental indicators included in EJSCREEN relate to air, dust, lead paint, waste, and water. Each of these environmental categories can be overlayed with six demographic indicators, which assess income, minority presence, education level, linguistic isolation, and age. The tool enables the user to individually view each of these indicators or combine a single environmental indicator with multiple demographic factors to produce an EJ index. It is important to note that the demographic and environmental data used in EJSCREEN have higher uncertainty when zooming in to small geographic areas, and the included indicators are not an exhaustive list of relevant issues. Therefore, the EPA cautions that any results gathered from the EJSCREEN tool should be supplemented with other information.
On Friday, February 26, Matthew Lee, an Environmental Protection Specialist within the EPA, and John Wolf, the GIS Team Lead for the Chesapeake Bay Program, joined our class to engage in a dialogue about EJSCREEN and its applications. Prior to this discussion, the class had also viewed a webinar in which the two men had presented on “Adding EJSCREEN and Local Tools to Your Environmental Justice Toolbox.”
Matthew Lee described the ongoing development of EJSCREEN since its creation in 2010. According to Lee, there has been a massive increase in the use of and interest in the tool, with the EPA adding enhancements every few years to support the EJ movement; the most recent change was the addition of climate risk layers. Although the tool is currently limited to state, regional, and national comparisons, staff are working towards county-level tools, and have designated funding for states who wish to create their own localized versions of EJSCREEN.
Pursuing one localized adaptation, John Wolf helped develop a modified version of EJSCREEN which focuses on the Chesapeake Bay Watershed, integrating data on toxic contaminants and climate resiliency. According to Wolf, the application is primarily a mapping tool at this point, and should be used in conjunction with other resources to make better informed decisions for those communities that have been traditionally underrepresented.
After these presentations, some students made suggestions for ways the EJSCREEN tool, and others like it, could increase their impact. One master’s student, Faith Taylor, highlighted the ways in which CalEnviroScreen, a California-specific tool, currently uses collected data to help appropriate funds to EJ communities, and recommends that EJSCREEN be used in a similar way. Nylah McClain, a Ph.D. student, wondered what incentive there might be to prevent states from inaccurately reporting on underrepresented communities, highlighting the distrust many individuals have of census information. Finally, master’s student Katrina Kelly pondered ways in which EJSCREEN could be used to start, or continue, direct dialogue with vulnerable communities to encourage and meaningfully incorporate their feedback.

It is clear that EJSCREEN, and localized versions, can be powerful tools to identify environmental inequalities in the United States. But they are just that—tools. The real possibilities stem from the programs’ potential to initiate dialogue with vulnerable communities and direct action. I encourage every reader to test out the tool and review environmental injustices in your community. We have the tool, now we need to use it.
References
California Office of Environmental Health Hazard Assessment. (2021, February 22). CalEnviroScreen. Retrieved from https://oehha.ca.gov/calenviroscreen
Chesapeake Bay Program Partnership. (2018). Using EJ Screen Chesapeake. Retrieved from https://www.arcgis.com/apps/MapJournal/index.html?appid=a1e201633cdf44dbbadd1a43eef4ffa7
Chesapeake Research Consortium. (2020, November 20). Adding EJSCREEN and Local Tools to Your Environmental Justice Toolbox [Video file]. Retrieved from http://chesapeake.org/crc-roundtable/november-2020/
US Environmental Protection Agency. (2020, October 6).What is EJSCREEN? Retrieved from https://www.epa.gov/ejscreen/what-ejscreen
US Environmental Protection Agency. (2020). EJSCREEN: Environmental Justice Screening and Mapping Tool. Retrieved from https://www.epa.gov/ejscreen
Yale Sustainability. (2020, October 1). Yale Experts Explain Environmental Justice. Retrieved from https://sustainability.yale.edu/explainers/yale-experts-explain-environmental-justice
About the author
Taylor Gedeon

Taylor Gedeon is a second year master’s student in the University of Maryland’s Marine Estuarine Environmental Sciences program, with a concentration in Environment and Society. She works with Dr. L Jen Shaffer to study the application of a socio-ecological framework to U.S. wildlife management, attempting to increase representative stakeholder engagement and support conservation measures. Taylor is also a member of a research team supported by the Maryland Department of Natural Resources that is examining beneficial use placement occurring in marshland on the Eastern Shore.
Next Post > Facilitating a Great Barrier Reef partnership workshop in Brisbane
Comments
-
Andrea M Miralles-Barboza 5 years ago
They are just tools, good point!
Hopefully they are tools that in the right hands can do more than just identify where vulnerable areas are- Faith made a great point about this disconnect. I wonder if there are ways to identify specific pathways of actions through these types of tools? (Places to meet people, community leaders, etc.) Not sure if thats the job of Artificial Intelligence or social scientists... maybe a little bit of both haha.
Good job :)
-
Isabel Sullivan 5 years ago
Great explanation of these tools! It seems like EJ Screen has laid a good foundation for assessing EJ and will hopefully continue to update this tool so that it can be used appropriately.
-
Faith Taylor 5 years ago
I love that your blog includes reflections from the students in the class! I think this really helps to connect the content of the blog with the course material
-
Chelsea Richardson 5 years ago
Hopefully they are able to add a local-level data to the tool soon. I think with local-level data, it will resonate with people more, as it hits closer to home and there will be a more collective action.
-
Jehnae 5 years ago
These tools are so important to the representation of all the communities, especially the underrepresented communities. I like the tie in to the individuals in class as well. Bringing everything full circle.
-
Amber 5 years ago
It will be interesting indeed to see how these tools are used in decision making. As you mentioned and was discussed, these are merely a tool, and the local communities should always be involved in the process of highlighting and addressed concerns.
-
Megan 5 years ago
Great blog, Taylor. Hopefully content like this continues to push tools to be even more useful
-
Amanda 5 years ago
Scale is really important and I agree that the local data would be a terrific addition. One thing that is challenging for me with the screening tools is how to best translate the baseline information into action. I think this is where a good facilitator, along with more nuanced and ground truthed data would be extremely valuable.
-
Katrina Kelly 5 years ago
You make a great point in highlight the value of analytical tools for use in our work (including that lovely green word cloud)! When it comes to the EJ Screen tool, it has the added benefit of being instrumental to supporting EJ work but also as a bridge between stakeholders that might spark conversations (or debates) and lead to more fruitful dialogue and collaborative problem-solving.
-
Olivia Wolford 5 years ago
Excellent use of visuals and a great summary of the utility AND limitations of these tools. I enjoyed that you integrated student comments to show the way we are working through these conversations in real time.
-
Nylah McClain 5 years ago
It really did/does bother me that the EJScreen team seems to have accepted that they can’t do anything to implement any incentives for proper tool usage.
-
Nylah McClain 5 years ago
It really did/does bother me that the EJScreen team seems to have accepted that they can’t do anything to implement any incentives for proper tool usage.
-
Sarah 5 years ago
"..with the EPA adding enhancements every few years..."
It is great that the EPA has developed this tool to map environmental indicators that relates to EJ, but why is it only enhanced every couple of years? Is there a reason why the enhancements are only happening every couple of years? What are the limitations of adding indicators and finding data that are restraining enhancements to every couple of years?
-
Peter 5 years ago
I suddenly thought of a question: Will EJ Screen cause fragile communities to become more fragile? Imagine that people who have access to this information will cause them and their related personnel to change to a better community, because relocation is a more convenient option than investing in and renovating current residences. On the contrary, people who have no informations and funds to support the relocation have to continue to stay in the original community, which leads to further class division. In the process, knowledge has also become an indicator of injustice.
-
Ashley Silver 5 years ago
I didn't realized this tool was developed 10 years ago. I hope with the continued development of the EJScreen tool all communities are represented appropriately.
-
Shakira 5 years ago
Taylor, you efficiently explained the EJSCREEN. Before this class (and the videos that were asked of us to watch) I had no idea what is was and if I was presented this blog before that class, I may have been more aware and knowledgeable of the tool. As you said they are just tools, I hope it is used to fix the EJ issues and injustices in the communities.
-
Imani Wilburn 5 years ago
I love the EPA's tool explanation and the tool link they have created. I think it is not only important to highlight an issue but also try to assist. I believe adding this tool to your post, as well as the EJscreen and its modified versions, even if a little, helps the issue at hand and shows your dedication to the issue. You have not only looked into the issue but also looked into ways to help the issue as well and that really helps the cause in my opinion.