Evolution of The Report Cards in Brisbane: Part One
Heath Kelsey · | Environmental Report Cards |Bill Dennison, Simon Costanzo and I made our annual pilgrimage to Riversymposium in September 2017 for the 20th anniversary of the event. This year the conference was back in Brisbane, Australia (it was held in Delhi in 2016). This is one of my favorite conferences, maybe because the City of Brisbane has become so comfortable for me, but I think it’s really the quality of the content, the clear focus on practices that create real impact, and the wonderful people I get to meet. Brisbane is a friendly, cosmopolitan city and easy to get around, so it’s easy to like it there.
I felt more engaged in the conference than ever this year. Although the theme focused on environmental flows, which is not usually my thing, I also sensed a movement toward holistic approaches and emphasizing goals such as co-creation and co-design with stakeholders, which I think is really exciting. It's what I find so exciting about much of the current work we do at IAN, and it was great to be able to talk about it and to hear it in other conversations throughout the meeting.
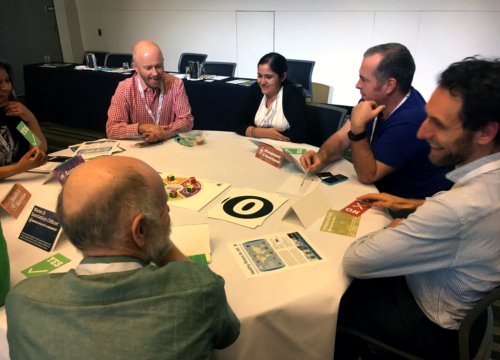
Predictably, our contributions to the conference were about ecosystem health report cards: Simon talked about the Orinoco River Basin Report Card, and my talk was on a recent shift in our thinking about the report card process. We also hosted, for the second consecutive time at Riversymposium, a special 90-minute session on “Get the Grade”, which is a role-playing game that introduces the benefits of having a report card to help understand decisions. Our work seemed to be received well, and we had lots of questions and follow-up conversations.
I was also able to attend a meeting of the Great Barrier Reef and Regional Report Card groups, which was a great chance to catch up and compare notes from others working hard and putting lots of effort into doing report cards right. The meeting is part of an ongoing effort to create stronger linkages among the regional catchment report cards and the overarching report card for the Great Barrier Reef. Because IAN helped create the original Great Barrier Reef Report Card in 2010 and participated in the inception of several of the regional report cards, it was especially gratifying to work with this group again, even if it was just for an afternoon. It is great to see things progressing well with that group. I also had the opportunity to share some of the new directions that IAN is pursuing with our partners, focusing particularly on our Healthy Rivers for All partnership with WWF. I think the cross-fertilization of ideas and approaches is a good concept and we should pursue more of it in the future.
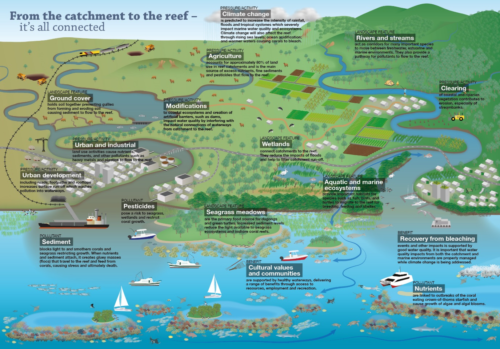
The discussions this meeting reinforced the idea of the continued evolution of report cards. Approximately 20 people attended, all of whom were simultaneously working on individual report cards and planning to integrate them with the larger Great Barrier Reef Report Card, as well as doing technical assessments related to achieving reef plan targets. The Great Barrier Reef Report Card is thoroughly integrated into the state and federal government management, and is planning effort in a way that it is not in Chesapeake Bay or other report cards that we have worked for in the United States. This is both wonderful and daunting; wonderful because our report cards are obviously valued as a framework for management and planning purposes by the Australian scientists and government, which we have always promoted, and daunting because focusing on all of these aspects of report card making at once seems overwhelming.
In hindsight, I wonder if there’s a benefit to separating the report card and the technical assessment slightly, so that the technical details don’t get in the way of the report card development, and the report card development doesn’t hinder the technical aspects of indicator development and data analysis. This is the approach that IAN is taking with the Florida Everglades Restoration Report Card. That project deliberately keeps discussion of the System Status Report separate from the discussion of the report card. The System Status Report will feed into the report card, and the report card provides a bit of a structural framework to build on, but the two are separate products and we treat them as such in the workshops.
About the author
Heath Kelsey

Heath Kelsey has been with IAN since 2009, as a Science Integrator, Program Manager, and as Director since 2019. His work focuses on helping communities become more engaged in socio-environmental decision making. He has over 15-years of experience in stakeholder engagement, environmental and public health assessment, indicator development, and science communication. He has led numerous ecosystem health and socio-environmental health report card projects globally, in Australia, India, the South Pacific, Africa, and throughout the US. Dr. Kelsey received his MSPH (2000) and PhD (2006) from The University of South Carolina Arnold School of Public Health. He is a graduate of St Mary’s College of Maryland (1988), and was a Peace Corps Volunteer in Papua New Guinea from 1995-1998.