Science Cafe and science communication training in Boston
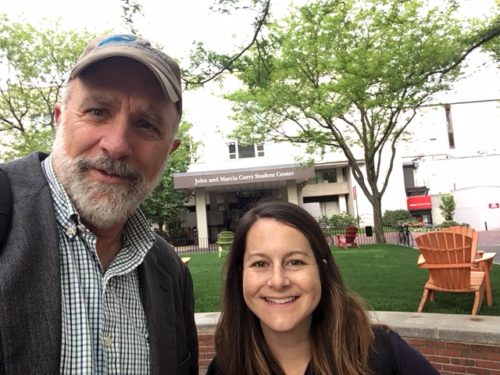
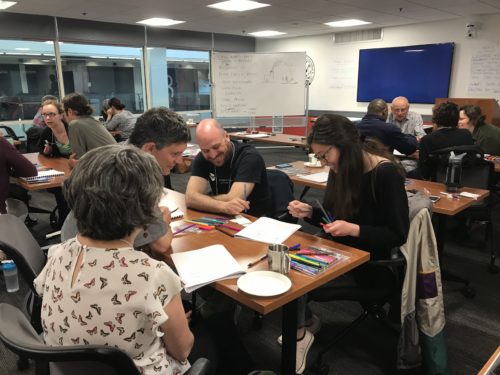
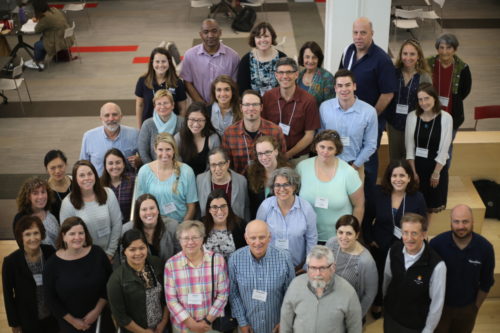
Bill Dennison ·Brianne Walsh and I traveled to Boston, MA to teach “Killer graphics and compelling narratives” at Northeastern University to an audience ranging from undergraduate and graduate students, to very experienced scientists. While most of the 36 participants were scientists, there were also representatives from the policy, communications, and journalism sectors as well. Participants included academics, municipal, state and federal agency folks, non-government organization people and private consultants. Carole McCauley, based at Nahant Laboratory, Northeastern University, was instrumental in deftly organizing the two-and-a-half-day course held in the Curry Student Center, a fantastic venue.

In addition to the workshop, I participated in the “Science Cafe: A discussion on data visualization in Boston.” This event was held in a pub in Cambridge, MA, and was organized by graduate students and Bob Chen from the University of Massachusetts, Boston. I spoke about seagrasses and their lack of coastal charisma, Brian Card from Amazon Web Services talked about an amazing visualization of Boston’s subway system (the “T”) and Jarrett Byrnes, from U. Mass. Boston talked about tropic cascades in kelp and seagrass ecosystems. Jarrett’s talk provided a great bookend to my talk. The Science Cafe was a lot of fun, with short talks, long breaks and a nice spread of food, good beer complemented by fantastic conversations.


On Day 1 of the “Killer graphics and compelling narratives” workshop, we focused on developing a compelling narrative, using techniques such as employing active titles, using the “. . . and . . . but . . . therefore . . .” (ABT) template, and creating word clouds. We talked a lot about identifying and communicating effectively to your primary audience.
On Day 2, we focused on the graphical elements, using paper storyboards or mockups before investing in actual graphics creation, aspects of color to keep in mind, how to declutter the “map junk” or “chart junk” to avoid having extraneous information obfuscate the message. We created conceptual diagrams and reviewed principles for good maps and photographs.

At the end of the second day, Sara Grady, the lead singer of the famous CERFtones, provided us with a wonderful rendition of “Margheritaville in Boston,” based on Jimmy Buffett’s Margaritaville classic. Carole refers to Carole McCauley, ABT refers to the “. . . and . . . but . . . therefore . . ." template developed by Randy Olson, and the title of the song in an homage to Margherita Pryor from the U.S. Environmental Protection Agency.

Margheritaville in Boston
17 May 2018
Sara Grady and William C. Dennison
Nibblin’ on Carole’s snacks
Trying not to be hacks
Learning to communicate the right way
Using my ABT
To help others we
Check out my science, hey what else can you say
Communicatin’ again in Margheritaville
Searching for the perfect diagram
Some people claim that caring too much is to blame
But I know, it’s good to give a damn
I don’t know he reason
I stayed here all season
Nothing to show but this great storyboard
But it’s a real beauty
A communication cutie
Somehow I did it, I struck a chord
Communicatin’ again in Margheritaville
Searching for the perfect diagram
Some people claim that caring too much is to blame
But I know, it’s good to give a damn
No more bad PowerPoint
I’m going to rock the joint
Using killer graphics that tell a great story
But it’s not easy to render
Data to reveal its splendor
That’s why I’m gonna work to achieve glory
On Day 3, we introduced integrated assessments and stakeholder mapping, and then broke into two groups. Brianne demonstrated Adobe Illustrator and Adobe In Design while I demonstrated the process of synthesizing data into a report card using real data from the Maryland Coastal Bays.
What was amazing about the report card exercise was that the different groups chose a diversity of different indicator assemblages and established different thresholds to calculate scores. In spite of this diversity of indicators, thresholds and calculation techniques, the relative rankings were quite uniform and corresponded favorably with the scores that we calculate to create the Maryland Coastal Bays report card. The lesson here is that indicator selection and threshold identification are necessary steps in assessment, but that actual indicators and thresholds chosen do not dramatically affect the final result as long as there is a diversity of indicators and a suitable number of them used (6-12).

At the end of the third day, we met with people associated with the Massachusetts Bays National Estuary Program about developing a report card for embayments along an extensive coastline that stretches from the New Hampshire border to Provincetown at the tip of Cape Cod. This coast includes the rocky North Shore, Boston Harbor and the myriad of islands, and iconic embayments like Plymouth, Barnstable and Wellfleet Harbors.
During the workshop, we established that there was a keen interest in creating a learning network among participants to collectively improve their science communication skills. To that end, we collected 100 word biographies of all participants and email addresses so that participants could stay in touch. Sara Grady once again sang beautifully, with some backing by James Taylor.
You’ve Got a Friend
18 May 2018
William C. Dennison
When you’re down and troubled
And you need some good advice
And nothing, nothing is going right
Send your draft straight to me
And I will soon get back to you
To brighten up your darkest night
You just email my name
And you know wherever I am
I’ll give my feedback once again
Winter, spring, summer or fall
All you have to do is call
And I’ll be there
If the sky above you
Grows dark and full of clouds
And that old computer starts to crash
Keep your head together and call my name out loud
Soon you’ll see my suggestions in your inbox
You just email my name
And you know wherever I am
I’ll give my feedback once again
Winter, spring, summer or fall
All you have to do is call
And I’ll be there
Now ain’t it good to know that you’ve got a friend
When people can be so cold
They’ll hurt you, and desert you
And take your soul if you let them
Oh, but don’t you let them
You just call out my name
And you know wherever I am
I’ll come running, running to see you again
Winter, spring, summer or fall
All you have to do is call
And I’ll be there, yes I will
You’ve got a friend
Ain’t it good to know
You’ve got a friend
Ain’t it good to know
You’ve got a friend . . .
About the author
Bill Dennison

Dr. Bill Dennison is a Professor of Marine Science and Vice President for Science Application at the University of Maryland Center for Environmental Science.