

Water Quality is Not Only Important, it’s Measurable
Joe Edgerton ·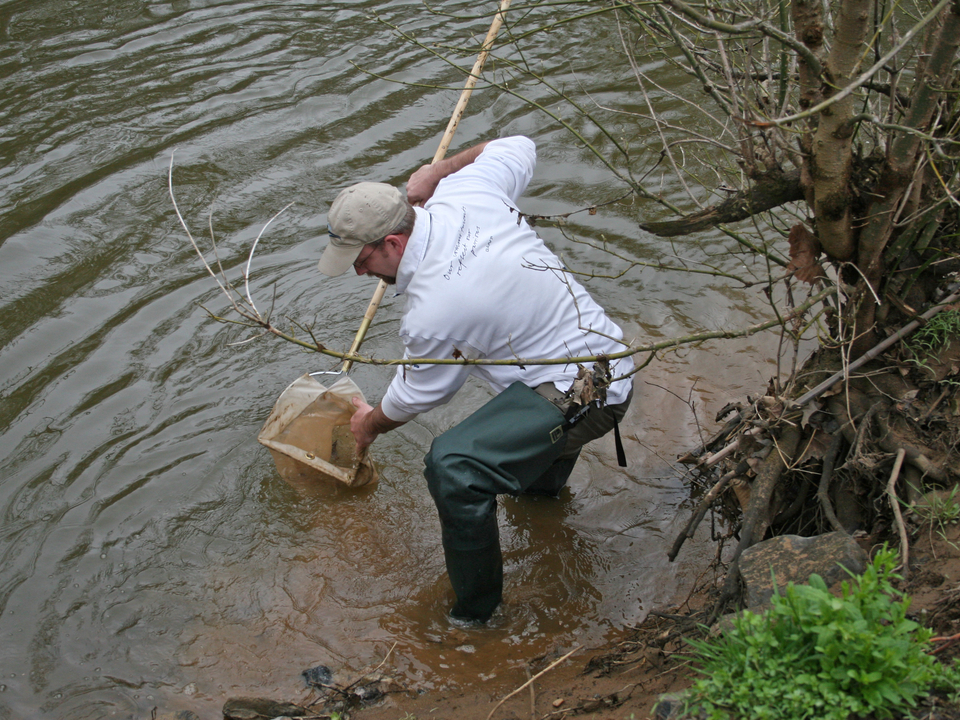
Water is crucial for sustaining life, human or otherwise. National Water Quality Month, an initiative started by the Environmental Protection Agency (EPA) in response to the Clean Water Act, highlights the importance of healthy water systems for human and environmental health. Throughout the month of August, social media has helped foster awareness of the importance of water quality, water as a natural resource, and the myriad of factors affecting our water systems.
Usually if someone is talking about water quality, I picture a faucet or fridge for drinking water, but that's a relatively simple view of the grand environmental scheme of water. Animals, economies, and cultures are all tied to water, so it's important to monitor its quality or "health" in the past and present in order to support future resource usage. But how can people judge if an environment has healthy water?
One way to answer that question is by using an environmental report card. Report cards are a great science communication tool for informing a variety of audiences about the status of water quality, among other factors, in a particular area. The water quality section of a report card contains several variables that contribute to water quality, such as: pH, dissolved oxygen, and electrical conductivity. At IAN, we refer to these measurable variables as "indicators." Our report cards include a variety of indicators divided into relevant categories. Choosing these indicators is a long-term collaborative process that includes as many people as possible.
In our report card process, indicator measurements are compiled from existing field and lab data sets and compared against established threshold values. Indicators that are nearer to their threshold values are scored as healthier than indicators that are farther from their targets. Eventually, water quality scores are produced on a grading scale similar to a school report card: A, B, C, D, and F. These scores are summarized and visualized in an environmental report card. Most of our report cards include water quality as a major category containing multiple indicators. You can view some of our recent report cards, and compare the water quality indicators we used, at this website.
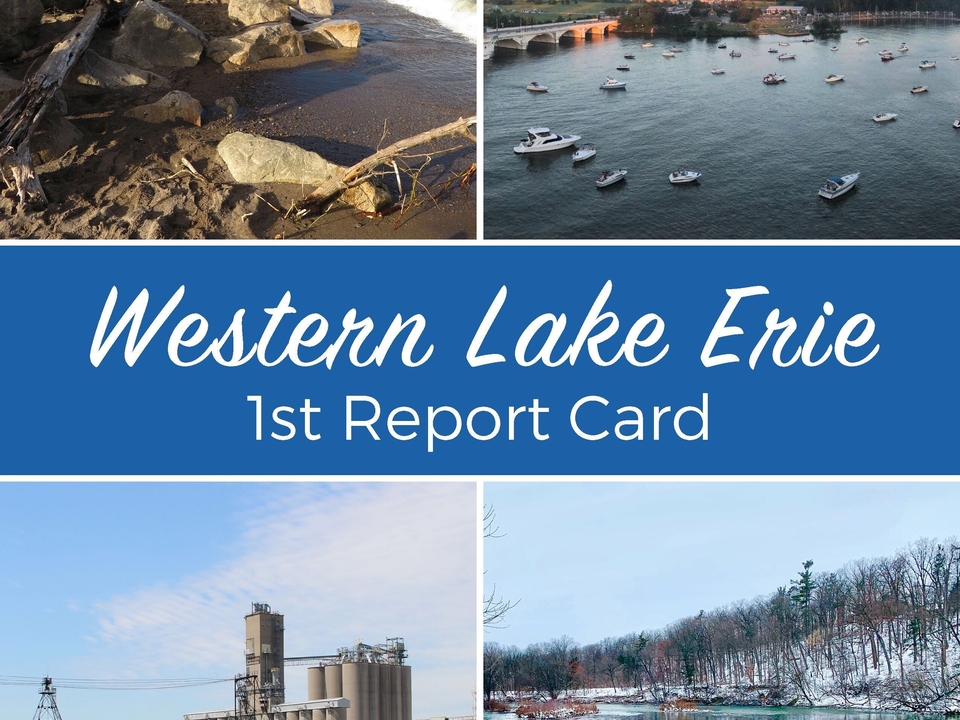
At IAN, we produce a wide array of science communication products, including report cards; One recent report card assessed the lake and watershed of Western Lake Erie.
Communication is always going to be relevant for people to visualize, discuss, and take action to improve water quality.
Photo Credits (in order of appearance):
Photo 1: "Testing Water quality" by Jane Hawkey is licensed under CC BY 4.0.
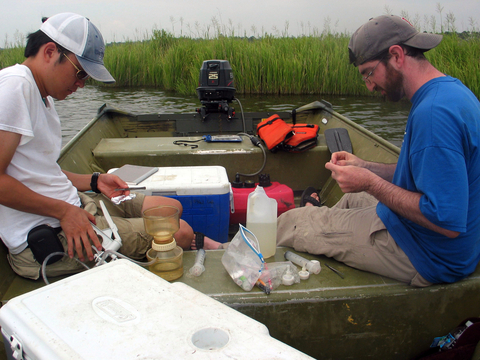
Photo 2: "Filtering water samples" by Hillary Stevens is licensed under CC BY 4.0
Photo 3: "Western Lake Erie 1st Report Card", provided by UMCES-IAN.
About the author
Joe Edgerton

Joseph Edgerton is an Assistant Science Communicator for the Integration and Application Network (IAN) within the University of Maryland Center for Environmental Science. Joe graduated from Oregon State University with a B.S. in biology in 2019. After undergrad, he became increasingly interested in data visualization and communication. Formally an IAN intern, he continues to assist IAN team members with designing science communication products, engaging stakeholders, and working with data. Joe enjoys travelling to nature parks, working with all things R code, and having “decent” hacky sack skills.