

Where Data Falters, Communication Flies
Nylah McClain · 17 commentsWe are in the development stages of our socioeconomic index for the Chesapeake Bay watershed. Our goal is to set a precedent that puts unabashed inclusivity and equal representation at the forefront of development. This seems to have put us in a position of regular dissatisfaction with what data is out there for us to use.
We have always been wary of how data represent minority groups. How minority groups are differentiated, if they are even differentiated at all, and who is included or excluded from minority group status are active concerns in our discussions. Since we are working with established data these concerns only become increasingly more prevalent because we are limited by interpretations that are not our own in a society that considers wealthy cis-gendered white men who are able-bodied and neurotypical to be the default.
So how are we approaching the selection of our indicators? So far the most helpful technique has been listing the pros and cons, namely the cons, of typically used indicators or indicators that we have an interest in. Highlighting the pros and cons of indicators evokes a sense of critique rather than a sense of just settling for what is available. We have also identified data we want that has not been provided by existing indicators. It may be that this data has been difficult to quantify or it simply has never been tackled, but there may be a socioeconomic aspect that could be useful for our index. The challenge is, how do we develop a new indicator with our current time constraints and limited knowledge of indicator development?
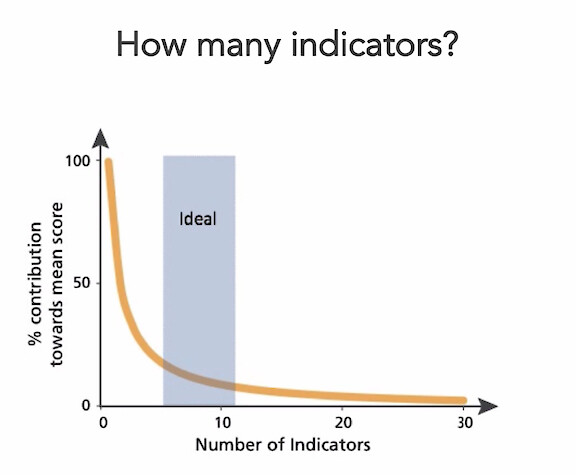
General discussion has also brought to the table the idea of combining indicators. This could result in an indicator that captures a wider range of people while minimizing the number of indicators that we have to choose from. The ideal number of indicators for an index is between 6 and 12. This limit reduces the amount of “noise” that too many indicators would result in, while giving us differentiation. We have listed over 20 indicators. This is an ample number of indicators that we can possibly combine. If indicators are combined into an index, more indicators can be included in the process and less need to be cut. This will certainly be difficult for us, as we see many of these indicators as necessary.
All of our challenges with identifying indicators really invigorates our insistence on speaking to members of the local communities and other stakeholders. By speaking to them we would know which indicators would actually provide a specific service to them, instead of picking indicators that we know are generally useful. I think it is our personal lack of local community and stakeholder communication that brings apprehension to our choosing of indicators. But we are growing more comfortable with the idea that the indicators we choose are not the concrete be-all and end-all, and soon we will be inviting members of the local community and stakeholders to the conversation, which I believe will make us feel as though we are really making progress towards a revolutionarily inclusive index.
Next Post > Facilitating a Great Barrier Reef partnership workshop in Brisbane
Comments
-
Andrea M Miralles-Barboza 5 years ago
Such a wonderful point Nylah- that a lack of data most often indicates where our institutions are failing marginalized groups. And YES the feeling of choosing indicators before stakeholders are in the room has been difficult for me as well. It does help to know they can propose new one or totally say no to ours if we are completely off base.
Good job!!!
-
Taylor Gedeon 5 years ago
Incredible blog from start to finish.
"We have also identified data we want that has not been provided by existing indicators. It may be that this data has been difficult to quantify or it simply has never been tackled, but there may be a socioeconomic aspect that could be useful for our index." Yes!! Just because the data for an indicator does not exist does not mean it is not significant. We also cannot identify all of the important indicators without consulting with those who are actually experiencing the injustice, like you pointed out. -
Isabel Sullivan 5 years ago
Awesome blog! When you said, "How minority groups are differentiated if they are even differentiated at all, and who is included or excluded from minority group status are active concerns in our discussions.", it reminds me of the talk by Cath O'Neil (https://www.ted.com/talks/cathy_o_neil_the_era_of_blind_faith_in_big_data_must_end?language=en) where she talks about the issue with our current algorithms in criminal justice. If those creating algorithms note that crime is occurring in a "diverse" area versus a "white" area, then the algorithm predicts that more crime will occur in diverse communities. As we know, this leads to more policing in minority communities. By using these algorithms, which use a blanket "diverse" category, decisions are being made by grouping together minority groups. As you said, this class will keep in mind how groups are or are not being differentiated.
-
Chelsea Richardson 5 years ago
Great post! Indicators should be selected based on relevance to the communities of the area being studied and that areas particular environmental concerns. The input from the local communities/stakeholders should inform what indicators are important and that should be used.
-
Megan 5 years ago
Great job! The issue of data being skewed to institutions with power today is a massive roadblock to progress, especially when working with natural scientists who are generally averse to drawing conclusions without robust numerical data. This is why research in both natural sciences and social sciences are stronger with people from different cultures informing them, as knowledge and data come in many forms. And why natural scientists can learn how to employ expert opinions where quantified data is irresponsible.
-
Amber 5 years ago
Such a great and well-written post. We don't often think about the pros and cons of the data available and how it can be improved, and this is an oversight on our part. No data are perfect, but, as Meg pointed out, involving social and natural sciences in the discussion of data use and collection can improve methodologies and usefulness of data.
-
Katrina Kelly 5 years ago
Nylah, you highlighted well the very real concern of an indicator selection process that does not include the conscious correction of skewed or missing data, and how that predicament came to be. Because there are so many layers, nuances, and aspects of environmental injustice, the challenge to avoid misdirecting statistical "noise" is legitimate. A great start in any case is to start where we are with what we have.
-
Faith Taylor 5 years ago
I love that you mentioned there is a need to engage stakeholders in indicator selection
-
Olivia Wolford 5 years ago
Great summary of class discussions and events- looking at this several weeks after, it does a great job reminding me of that stage in our indicator development. As you describe, it will definitely be important to have stakeholder input in future iterations of the project. Nice job!
-
Jehnae Linkins 5 years ago
Data availability is a major factor. indicaots
-
Jehnae Linkins 5 years ago
I hit submit before I was done....smh.
Data availability is a major factor. You are correct, Indicators should be based on the relevance of communities not just as a general thing. All communities are different and to better serve them we need the data to tell us what has been going on, how they have been underserved, and what can we do to help them.
-
Sarah 5 years ago
Your blog post is a great one. We have just completed two sessions of stakeholder engagement for our indicators and overviews. You stated the importance of including local community stakeholders, which I do not believe we were able to accomplish within the semester. The importance of including communities that are experiencing environmental justice issues within our report card is essential to its success. I hope that the future of this class will focus on involving communities and individuals that are experiencing EJ issues as these individuals are essential pieces to fit together this puzzle of an EJ Index in the Chesapeake Bay.
-
Imani Black 5 years ago
The process of us discovering our indicators and developing them was a little difficult for me as well. Especially having experienced first hand some of the indicators that we discussed and finally chose. It's hard to physically see a problem that has affect so many other around and want to further dive into the research to only find there's no data to be found. It's frustrating honestly but your blog was well written and I agree that the involvement of stakeholders and the communities we research could help the impact of this course moving forward.
-
Haoyu(Peter) Chen 5 years ago
The best discussion of indicators I have ever seen. It feels to me that you did a little research on indicators. Very delicate!
-
Shakira 5 years ago
This was a great blog Nylah.
"... we are limited by interpretations that are not our own in a society that considers wealthy cis-gendered white men who are able-bodied and neurotypical to be the default."
This is a concern I had while taking this class. I'm hoping these discussions from class as well as the work that was done helps to solve, or at least be a start to solving, these EJ issues. -
Ashley Silver 5 years ago
I agree with the local community are vital in deciding which indicators are important because they are directly impacted by the decisions made.
-
Imani Wilburn 5 years ago
I absolutely love your take on this issue. "in a society that considers wealthy cis-gendered white men who are able-bodied and neurotypical to be the default" is the best thing I have read in a long time! I often think about how data is collected and used, as a lot of times it is hard to get POC to participate in studies, scientific or whatever else, because of the past history and experiences they have faced. Knowing how big this issue is, but knowing its constraints, I know it is very important to get as many people involved as possible, and again, I love your take on the issue.