

Course in communicating science effectively
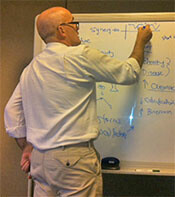
The Integration and Application Network is conducting a three-day course in communicating science effectively. The course is being held in Cambridge, Maryland, 1-3 May, 2012. The hands-on approach means that participants come away from the course with the technical skills to effectively communicate scientific information in a variety of communication products. Further details and online registration are available on the course website.UMCES Facebook challenge
Click 'Like' on the University of Maryland Center for Environmental Science's Facebook page and keep up with latest research to help find solutions to our environmental challenges. Help them reach 1,500 'Likes' by June 1 and one lucky 'friend' and a guest will be selected to join a science cruise on the state-of-the art Rachel Carson research vessel. Learn how water quality is measured, find out what's going on at the bottom of the Bay, collect fish and more, alongside marine scientists from the University of Maryland Center for Environmental Science.Assessing the vulnerability of the Great Barrier Reef to climate change
 Bill Dennison, Heath Kelsey, and Jane Thomas recently attended a Great Barrier Reef Foundation workshop to develop a synthetic publication that charts the vision for assessing the vulnerability to climate change. There are major climate impacts already being manifested, including sea surface temperature-induced coral bleaching, coral skeletal degradation due to ocean acidification, and relative sea level rise leading to inundation of mangroves. The development of a climate vulnerability index would provide a probability-based assessment of the likelihood of damage due to climate. This index is designed to complement the Great Barrier Reef report card.
Interactive symbol creation tutorial
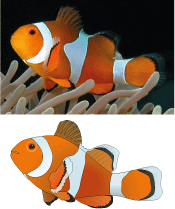 The Integration and Application Network's symbol libraries have been developed over many years by various science communicators. In our attempts to build a global symbol language, we also welcome contributions from anyone with relevant, high quality vector illustrations. To this end, we have developed an interactive tutorial to show you exactly how to trace this clownfish photo in Illustrator. It will introduce you to a variety of techniques that will allow you to develop your own symbols. If you find you lack the artistic flare to create your own symbols, and are in need of something that is not available in our libraries, you can contact us for a quote to have one of our talented science communicators make them for you.
Environmental report card workshop in Surfers Paradise, Australia
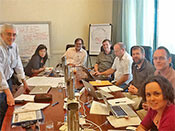 Sponsored by the Australian Water and Environmental Research Alliance (AWERA), a workshop on environmental report cards was held near Brisbane, Australia. This workshop focused on how environmental report cards have emerged as a technique to integrate data and provide feedback to a wide range of stakeholders as to the ecosystem health of a particular region. Workshop participants reviewed various environmental report cards globally, including those developed in Southeast Queensland, Australia and Chesapeake Bay, USA.
Streamlining environmental reporting in the Pacific region
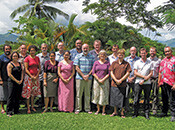 Bill Dennison, Heath Kelsey, and Jane Thomas from IAN traveled to Nadi, Fiji to facilitate a workshop held March 20-21, aimed at streamlining environmental reporting in the Pacific region. The 2010 Pacific Islands Forum Leaders’ and Forum Economic Ministers’ directive on reporting acknowledged the need to streamline global, regional and national reporting to reduce the reporting burden at the national level. The workshop outcomes are being summarized in a publication that will provide a vision for approaching a more effective and streamlined reporting for the Pacific region.