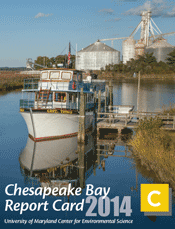
Chesapeake Bay health improved in 2014

Strong improvements were seen in 2014 Bay health as almost all indicator scores improved. Overall, Chesapeake Bay scored 50%, up from the
previous year's score of 45% (both C's). While the improvements are promising, most regions still have poor to moderate scores. The highest scoring indicator was dissolved oxygen (89%, an A), and the lowest scoring indicator was water clarity (15%, an F). Aquatic grass scores improved or stayed the same in all regions, due to the expansion of
Ruppia. Both nitrogen and phosphorus are showing significantly improving trends over time, while chlorophyll
a and water clarity have declining trends. This report card includes an analysis on the resiliency of coastal wetlands to current and future sea level rise rates as part of a Climate Change Resilience Index study. For further details, visit the
Report Card website.
 Strong improvements were seen in 2014 Bay health as almost all indicator scores improved. Overall, Chesapeake Bay scored 50%, up from the previous year's score of 45% (both C's). While the improvements are promising, most regions still have poor to moderate scores. The highest scoring indicator was dissolved oxygen (89%, an A), and the lowest scoring indicator was water clarity (15%, an F). Aquatic grass scores improved or stayed the same in all regions, due to the expansion of Ruppia. Both nitrogen and phosphorus are showing significantly improving trends over time, while chlorophyll a and water clarity have declining trends. This report card includes an analysis on the resiliency of coastal wetlands to current and future sea level rise rates as part of a Climate Change Resilience Index study. For further details, visit the Report Card website.